Turn Google Analytics Data Into Smarter Campaign Decisions

Automate your campaign management using Google Analytics insights to increase ROI and work more efficiently.
7-day free trial
No credit card needed

Make Better Decisions Using Accurate Tracker Data

Fix inflated CPAs, eliminate conversion discrepancies, and leverage funnel-level data to create smarter, data-driven optimization strategies.

Fix Conversion Tracking Gaps

Ask AI to compare ad network and Google Analytics data, uncover conversion discrepancies, and avoid optimizing on unreliable numbers.
Bar chart comparison showing Traffic Source Conversions versus Tracker Conversions side by side, highlighting discrepancies between ad network and Google Analytics 4 conversion counts

Track Real Cost per Action

Use blended tracker and traffic source data to analyze accurate cost per action. Get rid of inflated numbers that lead to bad optimization.
Traffic Source Statistics panel showing Traffic Source Spend of $450 divided by Traffic Source Add to Carts of 3 equals Add to Cart cost of $150 with a warning indicator, compared to Tracker Statistics below showing accurate blended cost per action data

Optimize Using Funnel Metrics

Use funnel metrics to asses performance and cut spend waste. No need to spend 2x-3x your CPA before killing underperforming assets.
Funnel flow diagram showing the path from Ad to Landing Page to Offer, illustrating how funnel metrics let you assess performance at each stage without waiting for final conversions

Optimize for Specific Events

Use early funnel events and custom metrics to help AI identify winners and underperformers before final conversions arrive.
Conversion funnel showing four stages: Customize Product, Add to Cart, Initial Checkout, and Purchase, used to identify winning and underperforming campaigns using early funnel events before final conversions arrive

Track the Impact of Funnel Changes

Know exactly how your funnel tweaks impact performance. Get alerts, pause, scale, or shift budgets based on what the data tells you.
ROI line chart showing campaign performance over Monday through Sunday with a Funnel Update marker on Thursday, tracking how funnel changes impact campaign ROI over time

Detect Click-Loss Problems

Monitor ad click-to-visit consistency and stop wasting budget when page load issues, redirects, or broken flows are killing conversions.
Table showing five campaigns with Ad Clicks and Funnel Visits columns. Performance Campaign 10 has 234 clicks and 199 funnel visits at minus 15 percent, Campaign 12 has 184 clicks and 202 visits at plus 9 percent, Campaign 06 has 347 clicks and 382 visits at plus 10 percent, Campaign 03 has 479 clicks and 305 visits at minus 36 percent, and Campaign 01 has 84 clicks and 27 visits at minus 68 percent, highlighting severe click-loss

Optimize With Precision as You Scale

Keep attribution sharp and reporting consistent. even when multiplying campaigns or expanding across multiple ad accounts.
Multi-line chart showing two campaigns tracked across eight weeks with consistent attribution, illustrating how TheOptimizer maintains accurate reporting while scaling across multiple ad accounts

Create Custom KPIs to Fit Your Goals

Build your own performance metrics using simple formulas that combine traffic source and third-party data. Think true CPA or blended ROAS.
Custom metrics builder showing a formula field with Publisher Revenue plus Traffic Source Revenue, precision set to 0.001 and format set to Number, used to create blended ROAS or true CPA metrics combining GA4 and traffic source data

Accurate Stats on All Campaign Levels

Get accurate attributed revenue and conversions across all campaign levels, giving you a clear and reliable view of performance.
Diagram showing a Google Analytics 4 logo connected by an arrow to TheOptimizer logo, representing accurate attributed revenue and conversions flowing from GA4 into TheOptimizer's unified reporting

Scale Across Multiple Channels

Expand across multiple ad networks. Launch, optimize and scale campaigns across multiple channels from one dashboard.
Integration orbit showing TheOptimizer at the center connected to Facebook, TikTok, Google Ads, Yahoo DSP, MediaGo, and other ad network logos, representing multi-channel campaign management powered by GA4 data
You Need This!
TheOptimizer scaled my business monthly revenue from $10k to over $200k. It's like having an employee who never gets tired and works 24/7.
Varunraj Keskar, Performance Marketer, TheOptimizer customer
Varunraj Keskar
Performance Marketer
Get Started for Free
TheOptimizer campaign management dashboard interface

Analyze, Optimize, and Scale from One Dashboard

Connect your ad platforms, analytics tools, and CRM data in one place. Use AI to uncover opportunities, execute optimizations, and automate repetitive work across multiple accounts.
Ask AI to uncover opportunities, execute optimizations, and automate repetitive tasks across all your accounts.
Combine ad network, analytics, and CRM data into custom metrics to power smarter decisions and automations.
Analyze performance across different time periods to detect trends, anomalies, and emerging opportunities.
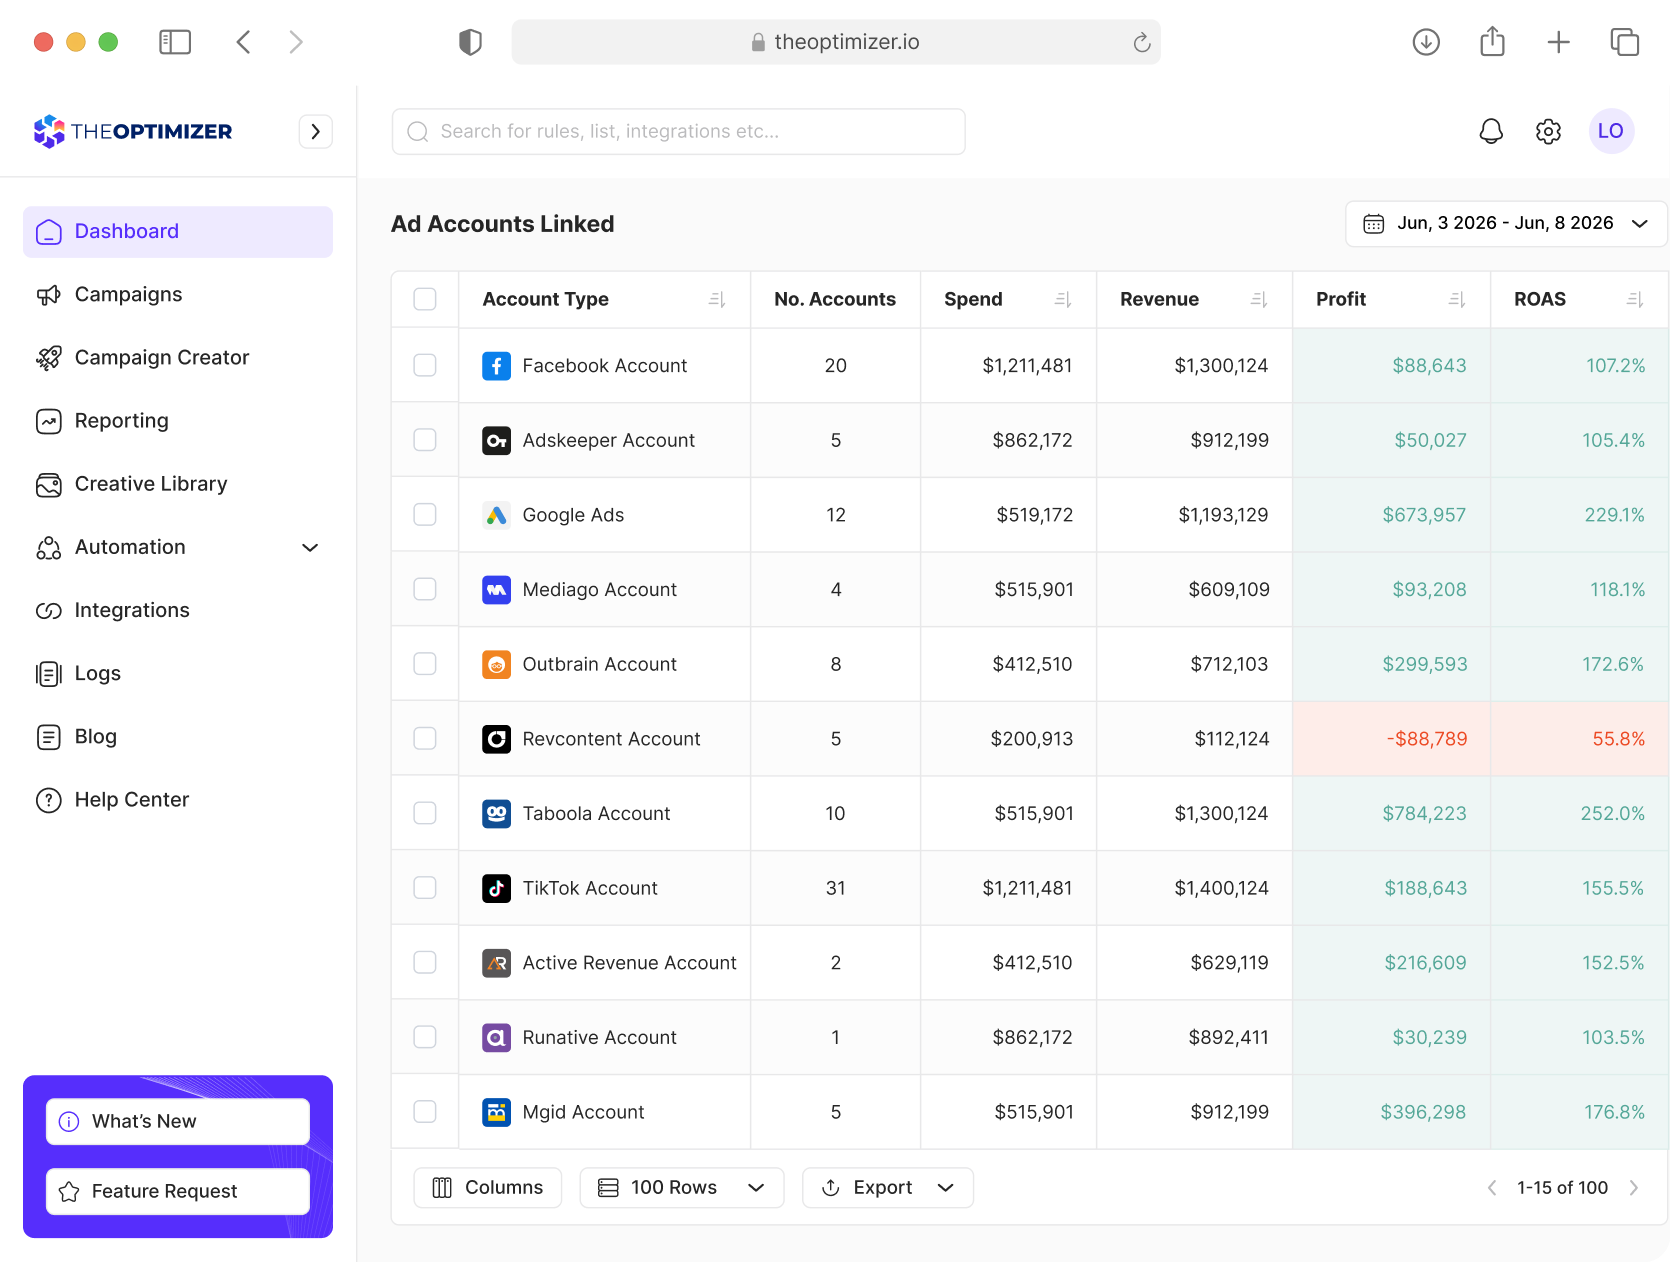
Report across hundreds of accounts, clients, and currencies from one place.
Get Started for Free
TheOptimizer unified dashboard showing ad accounts linked across multiple networks including Facebook, Google Ads, TikTok, Taboola, and Outbrain, with spend, revenue, and profit data combining ad network and analytics data