![]() Written by Support. Updated over a week ago
Written by Support. Updated over a week ago
The Reporting section is useful when you need to generate performance reports across multiple traffic sources, ad accounts, campaigns, ads and more.
Reporting types
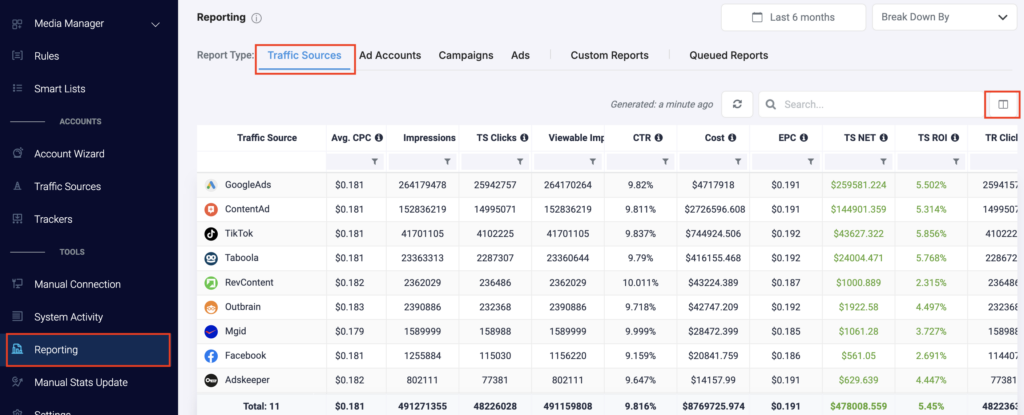
- You can create cross-traffic source reports. Simply go to Reporting, and click on the highlighted Traffic Sources tab. In one overview, you can compare performance across different traffic sources you are running ads on. On the right-hand side, the highlighted icon will allow you to customize the different metrics reported (remove metrics, add new metrics, and create custom metrics of your own).
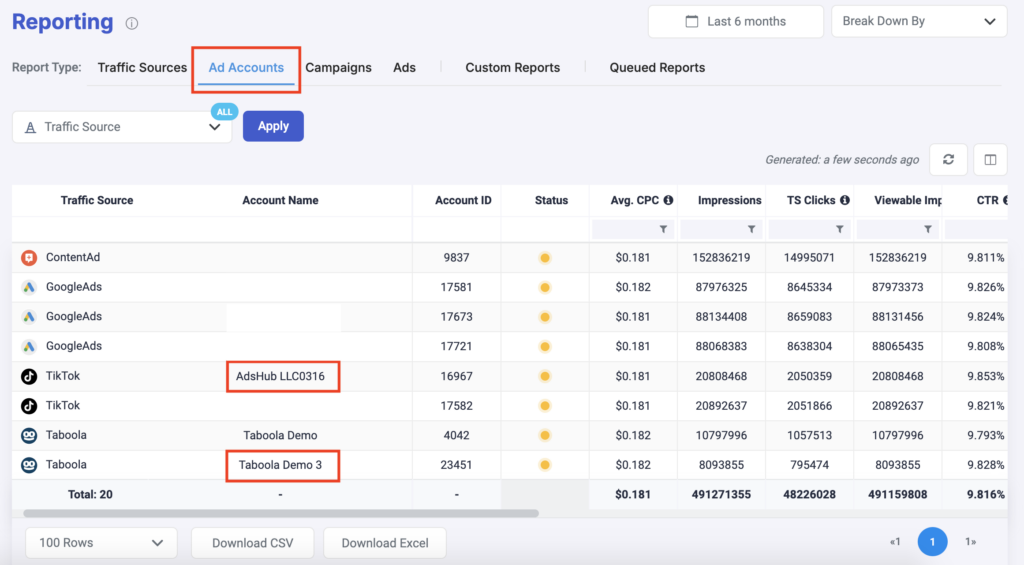
- You can also create cross-account reports. If you have multiple ad accounts per traffic source, you can now quickly evaluate their performance in one overview.
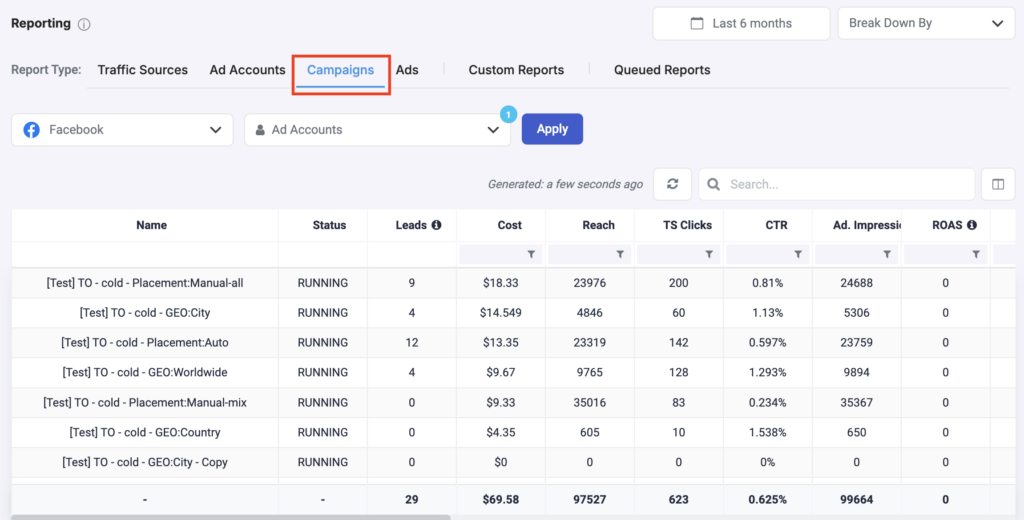
- You can create reports on Campaign level. Select a traffic source, and optionally an ad account, and compare performance across your campaigns.
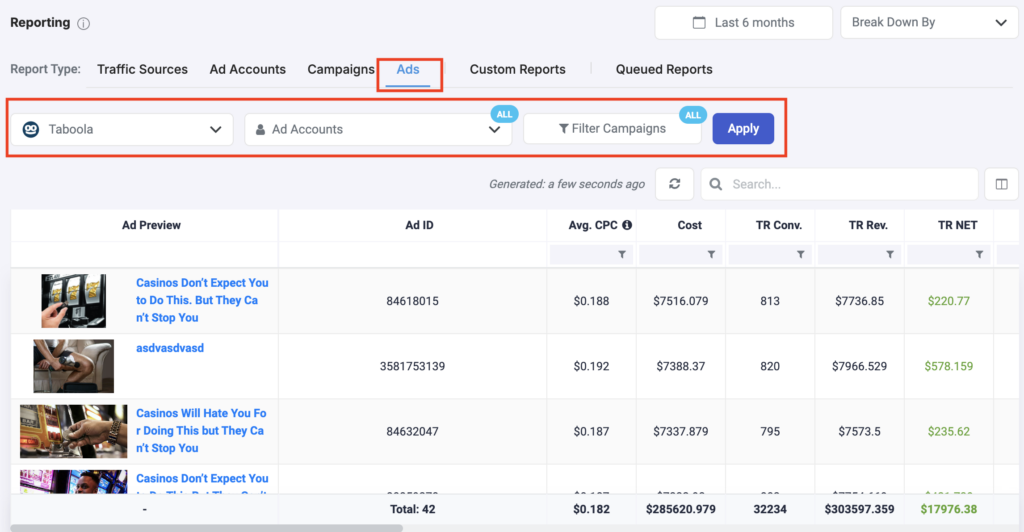
- You can go even further and create reports on an Ad level. Again, you will need to select a traffic source, and optionally a specific ad account. You even have the option of filtering your campaigns, so that you only see ads from active campaigns, for example.
- Under Custom Reports, you can dive deeper into traffic source-specific entities:


Generate a report
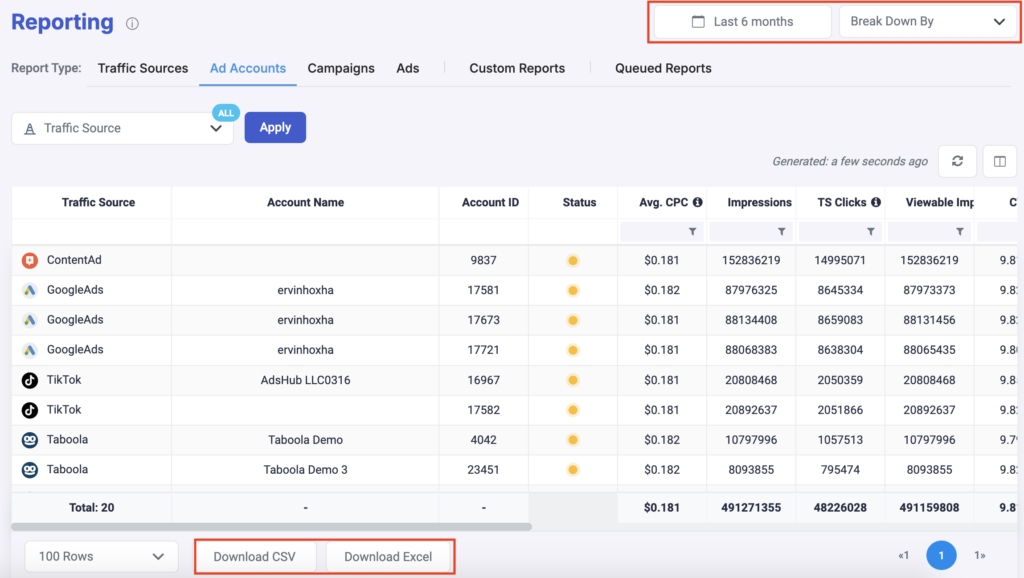
Step 1: Select the report type (e.g., traffic source, ad accounts, campaigns etc)
Step 2: Select the data timeframe for the report, spanning from Today to Last 6 months
Step 3: You can choose to break down data by day, month, or year
Step 4: If applicable, select specific traffic sources, ad accounts, or campaigns
Step 5: Click on Apply and generate your report
Step 6: You can optionally download your reports as CSV or Excel files
Manage reports
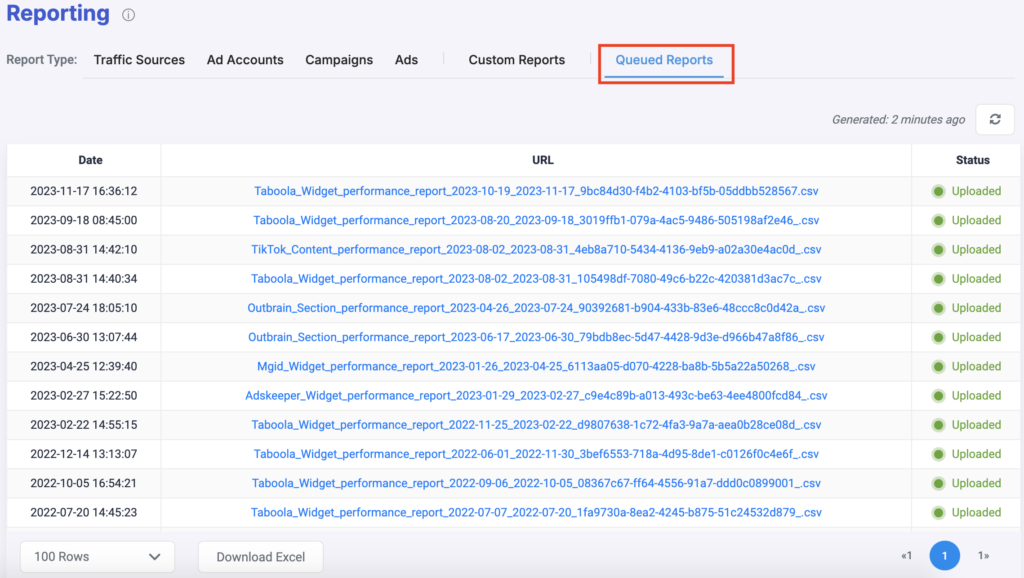
Under Queued Reports, you can find an overview of all reports you have downloaded.
Reporting use cases
- Build Blacklists
A “Blacklist”, is a list of placements (Widgets, Publishers, Sites, etc) that is performing bad, and it is usually preferable to stop receiving traffic from these placements.
An easy way to identify such placements is by using the Reporting section.
For example you can generate a Taboola Site reporting across all your connected accounts and all campaigns for the last 3 months. This reporting will show you how each site id is performing globally across all campaigns. You can then use this reporting to extract a list of Sites IDs with poor performance and use it to build your black list.
You can do the same for Outbrain Publishers, Sections, Revcontent widgets, etc. - Build Whitelists
A “Whitelist”, is a list of placements (widgets, publishers, sites, etc) that is performing good overall across all your campaigns.
It is a very common practice to use such Whitelist to create campaigns that are only targeting this list of placements (whitelist campaigns)
An easy way to identify such placements is by using the Reporting section.
For example you can generate a Taboola Site reporting across all your connected accounts and all campaigns for last 3 months. This reporting will show you how each Site ID is performing globally across all campaigns.
You can then use this reporting to extract a list of Sites IDs with good performance and use it to build your white list.
You can do the same for Outbrain Publishers, Sections, Revcontent widgets, etc. - Creative reporting across all campaigns
Another useful reporting is a reporting of your creative pieces (ads) across all your connected accounts and campaigns.
This gives you a clear overview on the performance of every creative, and allows you to focus on the best performing ones, as well as make decisions on the poor performing ones.
