How to Test Ad Creatives on Meta After the Andromeda Update (2026 Playbook)

Everything You Knew About Creative Testing Is Wrong Now!
Two years ago, the winning playbook looked like this: find one killer image, write 10 headline variations, split them across 5 interest-based ad sets, and let the winner emerge. Rinse and repeat.
That playbook is dead. And the people still running it are the ones posting on Reddit asking why their CPMs doubled overnight.
Here's what happened: Meta deployed Andromeda globally between late 2025 and January 2026. It's not a minor tweak. It's a ground-up rebuild of how ads get matched to users. The old system started with your audience selections. Andromeda starts with your creative. It reads the visual, the audio, the copy. It decides who should see it. Your targeting inputs are suggestions at best.
The result? Brands testing 20+ new ads per month are seeing 65% higher ROAS than brands testing under 10. The top-performing advertisers run roughly 395 live ads versus 296 for the bottom third. Creative volume and creative diversity are now the primary scaling levers.
But "test more creatives" isn't a strategy. You need to understand what Andromeda actually looks at, what GEM does with that information, and how to build a testing system that feeds the machine the right signals. That's what this article covers.
The Andromeda Pipeline: How Your Ads Actually Get Delivered
Before we talk about testing, you need to understand the delivery pipeline. This breakdown from Search Engine Land is the best plain-language explanation I've seen, and here's my condensed version.
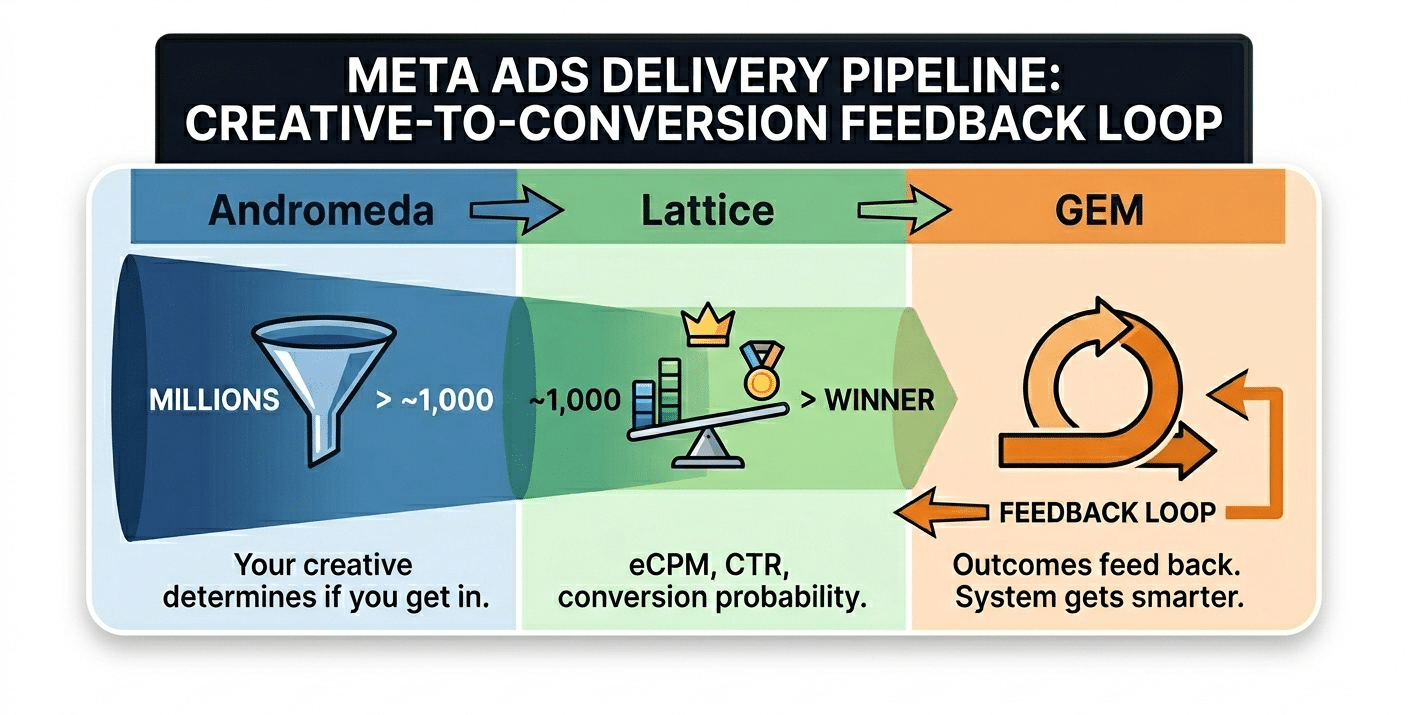
When someone opens their feed, three AI systems work in sequence to decide what they see:
Stage 1: Retrieval (Andromeda)
Andromeda scans tens of millions of eligible ads and pulls out roughly 1,000 candidates for this specific user at this specific moment. It does this by analyzing your creative using computer vision and AI audio analysis, then matching it against the user's behavioral patterns and intent signals.
This is the make-or-break stage. If Andromeda doesn't pull your ad into the shortlist, you don't exist in that auction. Your budget, your bid, your targeting, none of it matters. You need to get through the gate first.
Stage 2: Ranking (Meta Lattice)
Those ~1,000 candidates enter the ranking stage. Lattice calculates expected value for each one: eCPM, predicted CTR, conversion probability, competitive bids. It picks the winner. According to Meta's engineering team, Lattice delivered 10% metric gains and 6% conversion improvements.
Stage 3: Learning (GEM)
GEM (Generative Engagement Model) is the feedback engine. It's 4x more efficient at driving performance than what came before. When someone converts (or doesn't) after seeing your ad, GEM uses that outcome to improve future predictions. It also fills signal gaps when privacy restrictions block data by comparing your ad's performance against billions of historical data points.
What this means for you as a buyer:
Andromeda decides IF your ad gets a chance. Lattice decides WHO wins. GEM decides how the system LEARNS from the result. Your job is to give Andromeda enough diverse creative signals so your ads pass the retrieval gate across many different user segments. Not just one.
The Entity ID Problem (And Why 30 Ads Can Count as 1)
This is the concept that changed how I think about creative production. And it's the one most buyers still haven't internalized.
Andromeda doesn't look at your ad count. It looks at conceptual uniqueness. Meta assigns each creative an internal identifier called an Entity ID based on its visual fingerprint. If you upload 30 ads that share the same template, same background, same visual structure with different text overlays, Andromeda collapses them into one Entity ID.
One Entity ID = one ticket to the retrieval auction.
If that single ticket fails for a particular user segment, your other 29 "different" ads never get a chance. They don't exist in that auction. Performance data from admetrics.io suggests Creative Similarity Scores above 60% trigger retrieval suppression. 303 London's diversity guide recommends keeping the index below 40%.
This is huge. It means the old approach of "take winning image, test 15 headlines" actively hurts you now. Meta's visual recognition models see an image with slightly different text overlays as essentially the same image. According to Social Media Examiner's breakdown of the algorithm changes, if the system perceives a lack of diversity, it punishes your account with higher CPMs.
The practical framework for ensuring unique Entity IDs.
Before you build a new creative, ask three questions:
- Is the message different from what's already running?
- Is the visual execution different (not just text on the same template)?
- Is the format different (static vs video vs carousel vs UGC)?
If the answer is "no" to at least two of those, you're probably getting grouped under an existing Entity ID.
GEM, Lattice, and What They Mean for Your Testing
Most articles about Andromeda stop at "creative is targeting now." That's true but incomplete. GEM and Lattice add two layers that directly affect how you should design tests.
GEM learns from context, not just clicks.
GEM doesn't just track whether someone clicked or converted. It models the entire user journey. As this Medium breakdown explains, GEM compares your ad's performance against billions of historical data points to estimate directional lift, even when privacy restrictions block the direct signal.
For testing, this means early signals matter more than they used to. GEM starts forming opinions about your creative within the first few hundred impressions. A bad hook doesn't just waste those impressions. It teaches GEM that your creative isn't worth showing, and the system deprioritizes it going forward.
Lattice evaluates across attribution windows.
The Logical Position playbook explains that Lattice blends attribution windows at the architectural level. It evaluates success differently for high-ticket leads vs low-friction purchases because the system understands that timing and behavior vary by objective.
For testing, this means you need patience with high-consideration products. A creative selling a $2,000 product might look terrible at day 3 but solid at day 14 once the longer attribution window kicks in. Killing it early means you never see the real performance.
The Creative Similarity metric.
Social Media Examiner reports that Meta now exposes Creative Similarity as a metric in Ads Manager. High similarity = higher CPMs because Andromeda views repetitive content as fatiguing. It also surfaces "Top Creative Themes" so you can see which angles are resonating (humor, social proof, nostalgia, etc.).
Fair warning: because these metrics are new, Tara Zirker advises against over-optimizing for a specific score right now. Use them as directional signals, not hard thresholds.
The Testing Framework That Works Under Andromeda
Here's the framework I use. It's not theoretical. It's what I run on my own campaigns and what I built TheOptimizer's launching workflow around.
Step 1: Build 8 to 12 conceptually distinct creatives.
Not variations. Concepts. Use the PDA framework:
- Persona: Different buyer personas respond to different messages.
- Desire: Different motivations (save money, save time, look better, avoid risk).
- Awareness: Where they are in the journey (problem-aware, solution-aware, product-aware).
Our guide on creating 10 angles for the same offer walks through this in detail.
Step 2: Launch into a testing campaign (ABO).
- One creative per ad set. Clean data, no internal competition.
- Equal daily budgets ($20 to $50 per ad set).
- Broad targeting. Let Andromeda decide who sees what.
- Same optimization event as your scaling campaign.
Step 3: Evaluate after 7 days using multi-metric scoring (see formulas below).
Don't just look at CPA. Under Andromeda, a creative with a high hook rate and decent engagement might be worth keeping even if the CPA is slightly above target on day 7. GEM is still learning.
Step 4: Graduate winners to your scaling campaign (CBO).
Move proven creatives into a CBO campaign with broad targeting and let Meta allocate budget across the winners.
Step 5: Monitor for fatigue. Replace before the cliff.
Under Andromeda, fatigue windows have compressed from 6+ weeks to 2 to 3 weeks. Your pipeline needs to be producing replacements before current winners decline.
See our article on detecting creative fatigue early for the specific automation rules I use.
6 Custom Formulas for Evaluating Creatives in 2026
CPA alone doesn't give you the full picture anymore. Here are the formulas I use to score creatives. Some of these I picked up from other buyers in the community, some I developed from looking at my own data patterns.
1. Hook Rate (video)
Hook Rate = (3-Second Video Views / Impressions) × 100
Of the people who stopped, how many stayed? A high hook rate with a low hold rate means your opening promises something the rest of the video doesn't deliver. Target 20%+ for most verticals.
2. Hold Rate (video)
Hold Rate = (ThruPlays / 3-Second Video Views) × 100
Of the people who stopped, how many stayed? A high hook rate with a low hold rate means your opening promises something the rest of the video doesn't deliver. Target 20%+ for most verticals.
3. Outbound Click Ratio
OCR = (Outbound Clicks / Link Clicks) × 100
Compares clicks that leave Meta to total link clicks. A big gap means people are clicking (expanding the ad, clicking carousel cards) but not actually going to your landing page. Below 70% suggests curiosity without intent.
4. Qualified Visitor Cost
QVC = Spend / (Link Clicks × Landing Page View Rate)
Your real cost per person who actually loaded your page. If only 65% of clickers reach your page (slow mobile load, accidental taps), your effective CPC is 35% higher than what Meta reports. This number is what you should be comparing across creatives, not the reported CPC.
5. Creative Efficiency Ratio
CER = (Conversions / Impressions) × 1,000
Conversions per thousand impressions. Independent of budget allocation, which makes it the best apples-to-apples comparison when creatives received different amounts of spend. Track your account average and look for creatives at 2x+ above the mean.
6. Engagement Density
ED = (Reactions + Comments + Shares + Saves) / Impressions × 100
Overall engagement relative to delivery. A creative with low CTR but high engagement density might be building brand affinity that doesn't show up in direct response metrics. Worth monitoring for awareness-stage creatives.
How to Produce Enough Diversity Without Burning Out
The numbers say you need 10 to 20 new creative concepts per month. That sounds overwhelming until you systematize it.
The three-axis approach:
For each core angle, create one version in each format. So 5 angles × 3 formats (static, short video, carousel) = 15 genuinely diverse creatives. Each one gets its own Entity ID because the visual execution is fundamentally different.Production hacks that actually work:
- UGC doesn't need to be expensive. Build a roster of 3 to 5 creators who can each produce 2 to 3 clips per week. Total cost: $200 to $500/week depending on your arrangement. That's 6 to 15 pieces of unique video content.
- Repurpose what already works elsewhere. High-performing emails become static ads. Customer reviews become UGC scripts. Top organic posts become paid creatives. Every channel is a source.
- AI for copy, humans for judgment. Use AI tools to generate headline variations, hook ideas, and copy alternatives. But keep human review for visual design and final quality. Fully AI-generated visual creative tends to underperform.
- Carousels are back. Social Media Examiner confirms carousels are performing very well in 2026 and count as a distinct format for Entity ID purposes. Each carousel card with a different visual adds diversity to your library.
- Static images still convert. Don't abandon statics for video. Data shows statics still drive 60 to 70% of conversions on Meta. A healthy library has both.
Recommended production volume by spend:
Launching Tests at Andromeda Scale
Here's the practical problem nobody talks about. You've produced 15 diverse creatives. Now you need to build 15 ad sets, upload each creative, configure identical settings across all of them, set naming conventions, and launch. In Ads Manager, that's 2 to 3 hours of clicking.
And you need to do this every week.
This is exactly why I built the Campaign Launcher inside TheOptimizer. The workflow:
- Save your testing structure as a template. Campaign objective, bid strategy, budget, placements, pixel, optimization event. Set it once. Reuse it every launch.
- Upload creatives to the Creative Library and tag them by angle, format, or test batch.
- Open the Launcher, select your template, pull in the tagged creatives. Add your copy variations, headlines, and destination URL.
- Launch. The system builds all the campaigns, ad sets, and ads automatically.
In our published case study, I launched 89 campaigns with 630 ads across multiple ad accounts and fan pages in under 60 minutes. What would have been an entire day in Ads Manager took less than an hour.
But here's the part that matters even more: after launch, your automation rules kick in immediately. Stop-loss pauses non-converters every 10 minutes. Budget scaling grows winners at the right pace. Fatigue detection catches declining creatives before CPA spikes.
You're not just launching faster. You're launching into a managed system that runs 24/7.
FAQ
What is an Entity ID and why does it matter?
An Entity ID is Meta's internal identifier for a creative concept. Andromeda uses computer vision to analyze your ad's visual pattern and assigns an ID based on what it "sees." Visually similar ads get the same Entity ID and compete with each other instead of expanding your reach. To get unique Entity IDs, your creatives need to differ in visual execution, not just copy or headlines.
How do I check my Creative Similarity Score?
Meta has started exposing Creative Similarity in Ads Manager under creative performance metrics. Scores above 60% indicate Andromeda is treating multiple ads as one. Keep it below 40% for best results.
Should I still use interest-based targeting for creative tests?
For most accounts, broad targeting outperforms interest stacking under Andromeda. The algorithm reads your creative to determine the audience. Run a test if you want to verify: same creatives, one ad set broad, one with interests, same budget, 7 to 14 days. Compare CPA and lead quality. In our experience, broad wins most of the time.
How long should I run a creative test before deciding?
7 days minimum. This captures a full weekly cycle including weekday and weekend behavior. Make sure each creative has at least 1,000 impressions (ideally 3,000+). Evaluate using the multi-metric scorecard, not just CPA. For high-consideration products, extend to 14 days.
What's the minimum budget per creative for a reliable test?
$100 to $150 per creative for statistical confidence. But your stop-loss rules will kill obvious losers early at $10 to $30 in spend, so most of your budget concentrates on the promising ones. You're not spending $150 on every creative. You're spending $150 on the survivors.
What hit rate should I expect?
5 to 10% is normal at scale. One documented study showed roughly a 6.6% hit rate. Don't be discouraged. The winners more than pay for the losers. That's the whole point of testing at volume.