
How to Access Logs
There are two ways to access Logs, depending on how much scope you need. System-wide Logs — accessible from Logs in the left-side navigation menu. This view shows every log entry across your entire account: all ad networks, all campaigns, all team members, all rules. Use this when you need to investigate across the whole account or when you’re not sure which campaign to look in. Item-specific Logs — accessible from within the Campaign Manager. Open the Details view for any campaign, ad set, or placement, then click the Logs tab. This shows only the log entries for that specific item, making it much easier to trace the history of a single entity without any noise.Log Types
Every log entry belongs to one of three types. Manual logs are generated when a team member takes a direct action in the interface — changing a bid or budget, pausing or activating a campaign, cloning an ad set, and so on. Manual logs tell you who did what and when, which is essential when multiple people work across the same accounts. Rule logs are generated automatically each time an automation rule executes. They capture what the rule did (or decided not to do), what the metric values were at the moment of execution, and whether the action succeeded or was skipped. List logs are generated when a Smart List runs and blocks placements across campaigns. They tell you which placements were blocked, on which campaigns, and when.The Logs View
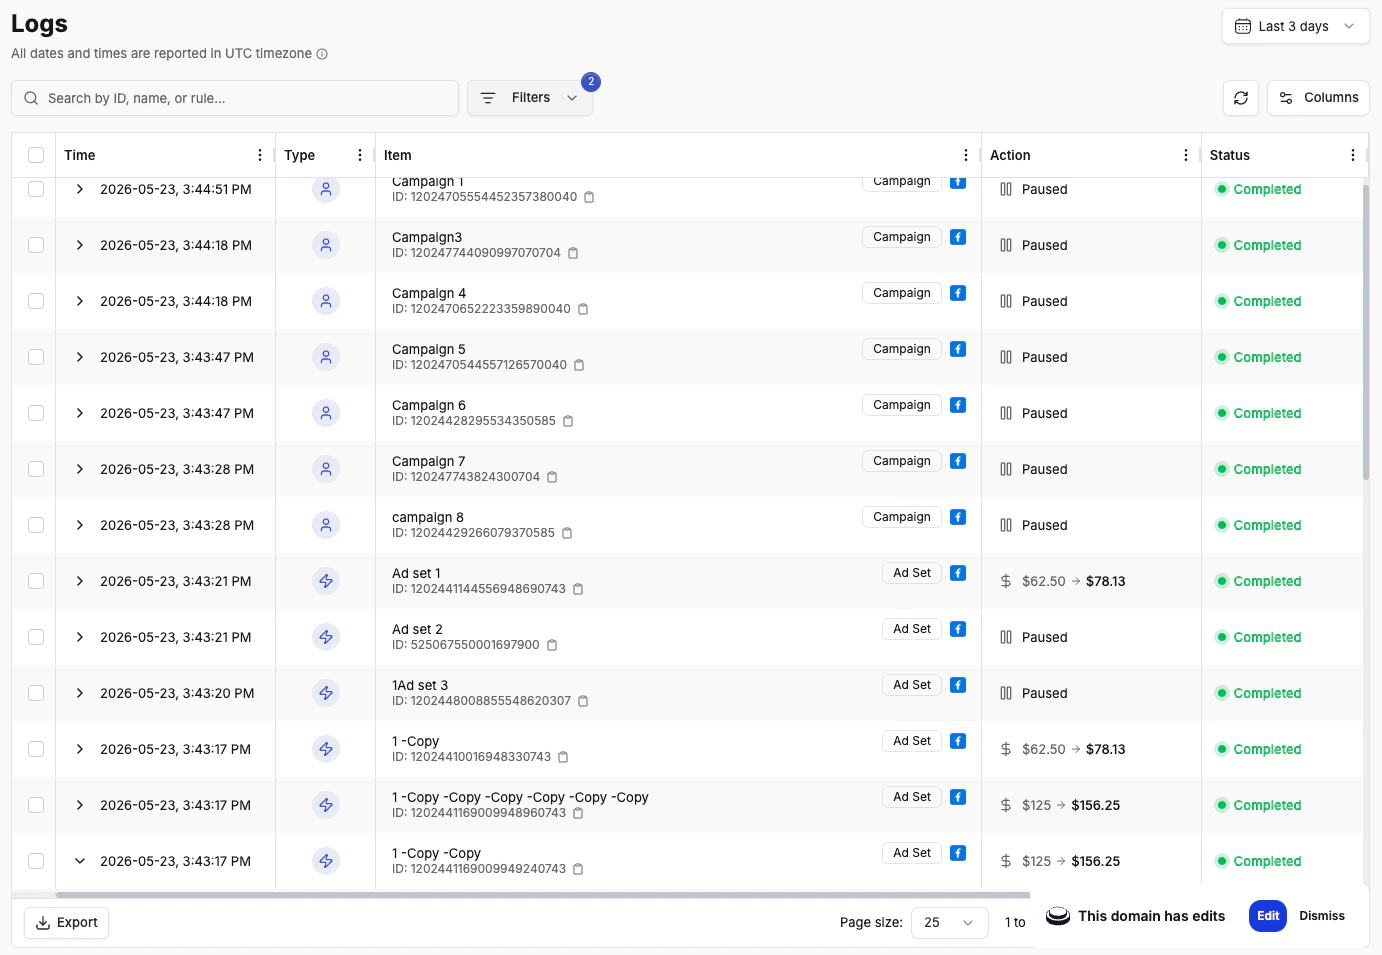
Searching and Filtering
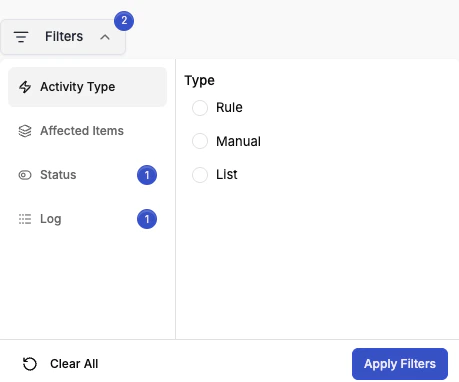
- Activity type — show only Manual logs, Rule logs, or Smart List logs.
- Item type — filter to a specific level: campaign-level changes only, ad set changes, ad changes, placement changes, and so on.
- Status — filter by Completed, Failed, or show Info logs (see No Change / Info Logs below).
- Rule — show only logs generated by a specific automation rule. Useful for auditing what one rule has been doing.
- Campaign — show only logs that belong to a specific campaign.
- Free text search — the search bar accepts any text: a campaign name, an item name, a placement ID, or any other string present in the log data.
- Date range picker — on the right side of the filter bar, select a time window to show older or more recent logs.
Table Columns
| Column | Description |
|---|---|
| Time | UTC timestamp of when the log was recorded. All timestamps in Logs are in UTC — convert to your local timezone as needed. |
| Type | Whether this is a Manual, Rule, or Smart List log entry. |
| Item | The entity that was affected. Shows the ad network logo, the item name, and its ID. A quick-copy icon lets you copy the ID to your clipboard. |
| Action | What actually happened. For bid and budget changes, this shows both the original value and the updated value. For pause/activate actions, it shows the direction of the change. For cloning, it shows that a clone was started (see note below). |
| Status | The outcome: Completed, Failed, or No Change (see below). |
Cloning actions only log the start of the process. Because cloning involves a large amount of data and multiple steps, the full result is sent to you by email once the process completes. The log entry here confirms the clone was initiated and includes information about the source and target item.
Status Values
Completed means the action was executed successfully. A rule fired, the condition was met, the change was applied, and the ad network confirmed it. Failed means something went wrong. The action was attempted but did not succeed. Expanding a failed log entry (see below) will show the specific error that caused the failure. No Change means a rule ran, evaluated all its conditions, but determined there was nothing to do at that moment. This is not an error — it is the system confirming the rule is still active and executing on schedule. Common reasons include:- One or more conditions were not met (e.g., the spend threshold wasn’t reached)
- The target value was already at the limit (e.g., a budget cap rule where the budget is already at the maximum allowed value)
No Change / Info Logs
No Change logs are hidden by default to keep the table focused on meaningful activity. To show them, open the filter panel and toggle Show Info Logs, then apply the filter. Toggle them back off to hide them again when you’re done.Expanding a Log Entry
Click on any row in the table to expand it and see the full details for that log entry.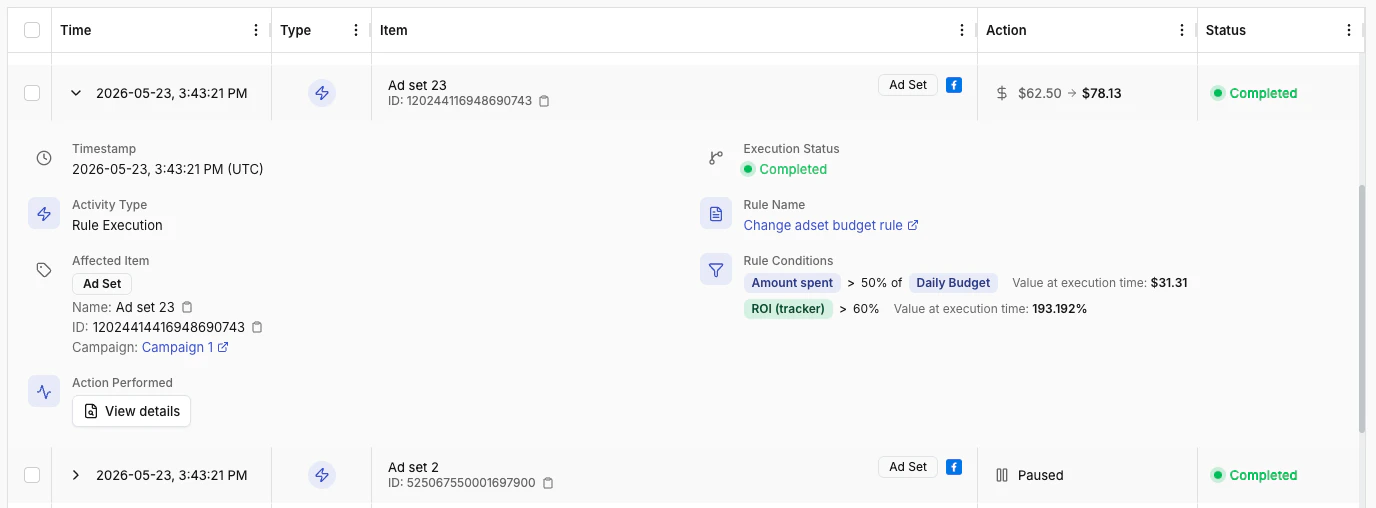
- Timestamp, activity type, affected item — the same information visible in the table row, presented in full detail.
- Execution status — Completed, Failed, or No Change.
- Error details (failed logs only) — a description of what went wrong, useful for diagnosing issues like insufficient permissions, API errors from the ad network, or configuration problems.
-
Rule conditions (rule logs only) — for each condition defined in the rule, the expanded view shows:
- The condition as configured (e.g., “Amount Spent > 50% of daily budget”)
- The actual metric value at the moment the rule executed (e.g., “Amount Spent was 100”)