The Details View is a side panel that slides in from the right when you click View Details on any campaign, ad set, or ad. It gives you a deep look at a single item without leaving the main table, and supports continuous navigation between items so you can review multiple campaigns without repeatedly opening and closing the panel.
At the top of the panel:
- Item name — the name of the campaign, ad set, or ad you are viewing
- ← Prev / Next → — move to the previous or next item in the table without closing the panel
- Totals — a summary bar showing Cost, Revenue, NET, and ROI for this specific item
- Date picker — adjusts the data shown in the Details View independently from the main table date picker
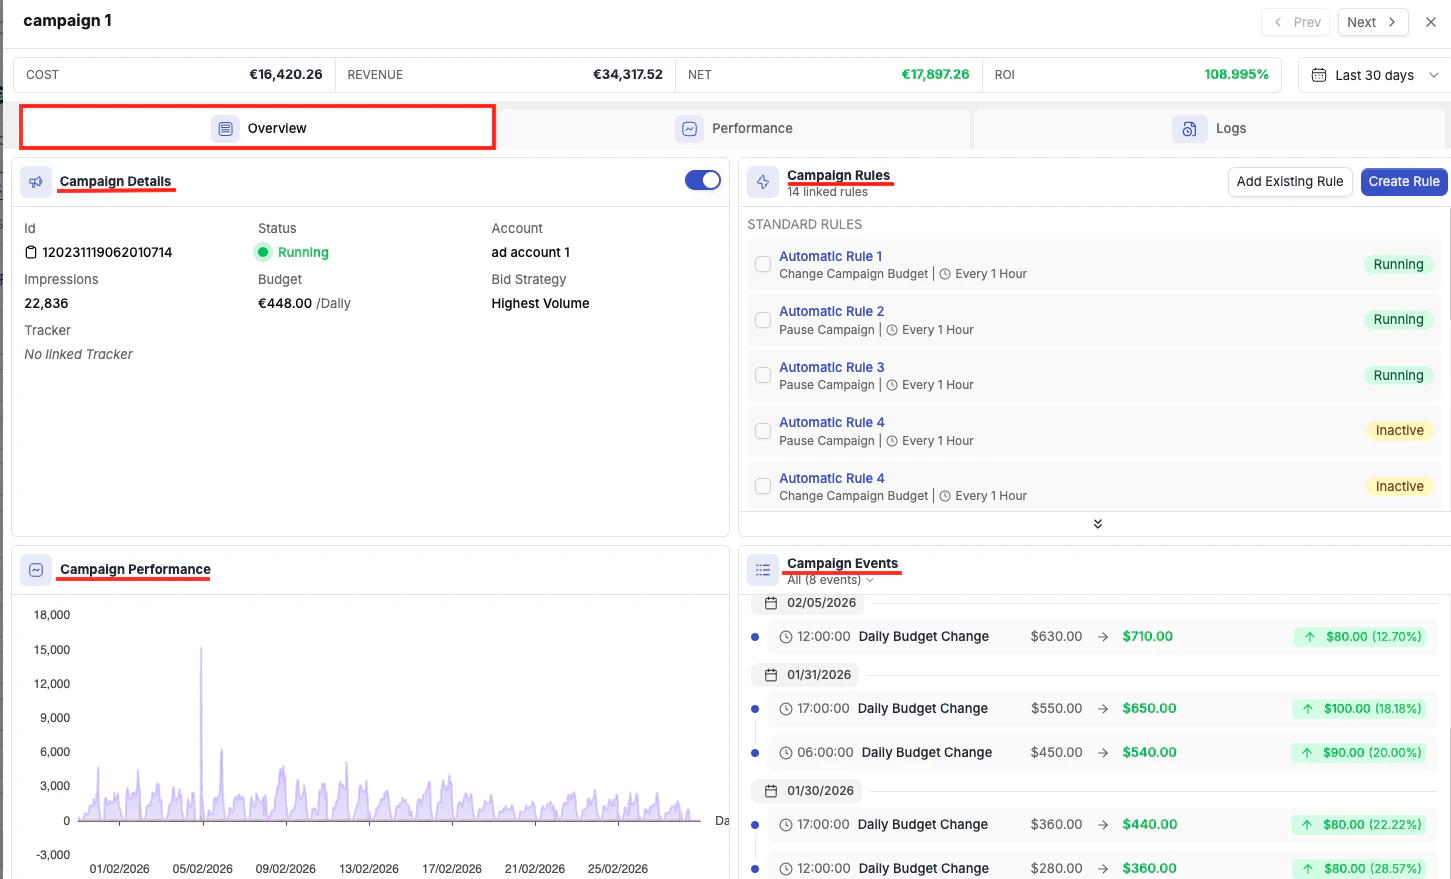
Overview Tab
The Overview tab provides a snapshot of the item’s status, configuration, and recent activity. It contains four widgets.
Campaign Details
A card showing the item’s key configuration data:
| Field | What it shows |
|---|
| ID | The campaign, ad set, or ad ID on the ad network |
| Status | Current status (Running, Paused, etc.) |
| Account | Which ad account the item belongs to |
| Budget | Daily or lifetime budget and type |
| Bid Strategy | The bidding approach (e.g., Highest Volume, Cost Cap, Target CPA) |
| Tracker | Which tracking platform is linked, if any |
Automation Rules
A list of all automation rules currently attached to this campaign. From here you can click Add Existing Rule to link a rule you have already created, or Create Rule to build a new rule and attach it in one step.
Reviewing attached rules in the Details View is a fast way to audit what automation is in place for a specific campaign without navigating to the Rules section.
Events Timeline
A timeline of all significant changes the campaign has undergone during the selected period — budget changes, bid changes, status changes, and similar events. This is your audit trail for understanding when something changed and correlating it with performance shifts visible in the Performance chart.
Use the Events Timeline alongside the Performance Chart together. If you see a dip in conversions, scroll the Events timeline to see whether a budget cut, bid change, or rule action happened around the same time.
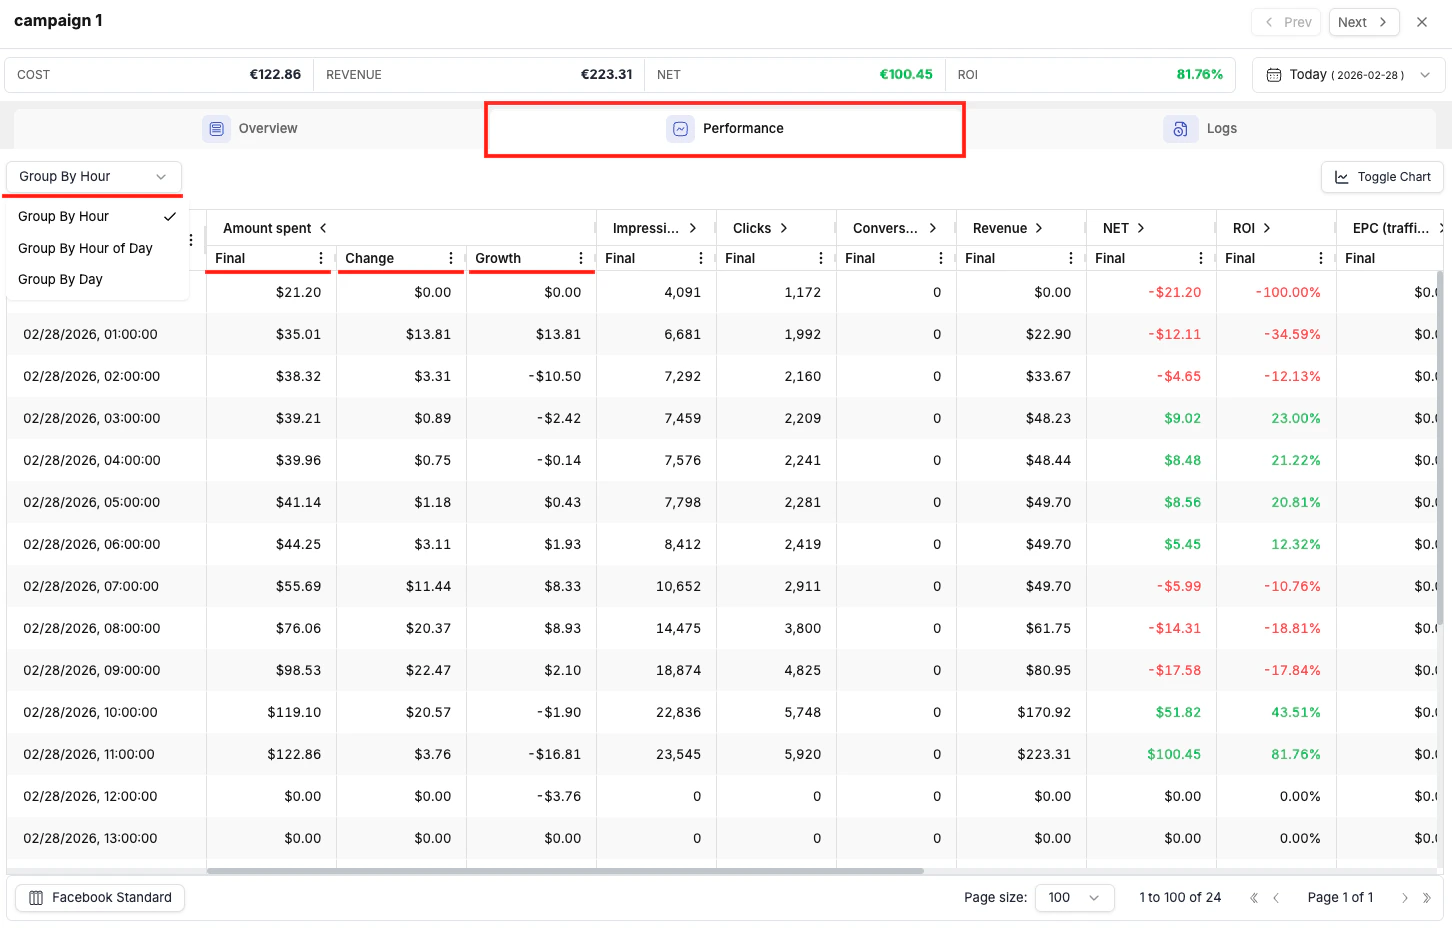
The Performance tab lets you break a single campaign’s data down by time dimension. The available breakdowns are By Hour, By Hour of Day, and By Day.
When you use By Hour of Day with a multi-day date range (e.g., Last 7 Days), it aggregates traffic from all days at each hour — so “10 AM” shows the combined performance of every 10 AM–11 AM slot across the entire selected period.
You can expand each column to show change treds (hour by hour, or day by day depending on the selected grouping option). Each column is going to show 3 values:
Final - Is the final accumulative value recorded up to that moment (day or hour). For example if you are looking at amount spend at 11:00 AM, the Final value is the amount spent up until that hour.
Change - Is the value of each single hour considered separately (difference between h and h-1). In case of the spending for example it gives you an understanding of how much you are spending on each single hour separately.
Growth - It shows the trend between to consecutive hours or days (depending on which intervals you are looking at). It shows you if from one hour to another the spending has been decreasing or increasing.
Practical Use Case: Finding Your Best Hours for Dayparting
Open the Details View
Click View Details on the campaign you want to analyze.
Set the date range
Set the date range to Last 7 Days or Last 14 Days for a meaningful sample.
Switch to the Performance tab
Click the Performance tab inside the Details View.
Set the grouping to Hour of Day
Select the By Hour of Day breakdown.
Identify weak hours
Review which hours have strong conversions and ROI, and which are underperforming.
Create dayparting rules
Use these findings to configure time-based automation rules that pause the campaign during low-performing hours and resume it during peak hours.
The Performance tab is available at campaign, ad set, and ad level. Running an hourly breakdown on a specific ad set can help you determine whether poor performance is time-related or structural — giving you a more targeted optimization path than looking at the campaign aggregate.
Logs Tab
The Logs tab shows a complete history of all actions that have affected the item — whether triggered by automation rules or made manually by a team member.
Each log entry shows:
| Field | What it shows |
|---|
| Time | When the action occurred |
| Action | What was done (e.g., budget changed, campaign paused, bid adjusted) |
| Activity Type | Whether the action came from a rule (and which rule) or from a manual user action |
| Change | |
The Logs tab is invaluable when investigating why a campaign’s performance changed unexpectedly. Cross-reference log timestamps with the Performance Chart in the Overview tab to understand what action preceded the change.
Manage Tab
Beyond the three universal tabs, some ad networks add an extra tab to the Details View that exposes platform-specific optimization data.
Native Ad Networks — Publisher & Site Breakdown
For Taboola and Outbrain, a Manage tab appears at the campaign level with a placement-level performance breakdown — the equivalent of the “Sites” or “Publisher” reporting in the native dashboards.
- Taboola — the Manage tab shows performance broken down by individual publisher site. You can identify which sites are driving results and pause underperforming sites directly from this view without navigating away.
- Outbrain — the Manage tab shows performance broken down by publisher and by section within each publisher. You can pause underperforming publishers or sections directly from this view.
Facebook — Ad Set Level: Manage Targeting Tab
When you open the Details View for a Facebook ad set (not a campaign), a Manage Targeting tab appears. It contains three sub-breakdowns:
| Sub-tab | What it shows |
|---|
| Placement | Performance by ad placement (Facebook Feed, Instagram Stories, Audience Network, etc.) |
| Device | Performance split by device type (Mobile, Desktop, Tablet) |
| Geo | Performance by targeted geography |
Run a placement breakdown on your best-performing Facebook ad sets to identify whether a single placement (e.g., Facebook Feed) is driving all results while others (e.g., Audience Network) consume budget without converting. Excluding poor placements at the ad set level is a fast, impactful optimization move.