10 Best Facebook Ads Reporting Tools in 2026 (Free & Paid)

Facebook Ads Manager gives you enough data on your campaigns, but not the clarity you need to read them adequately.
A reporting layer goes beyond what Meta gives you natively. It becomes the go-to tool for agencies sending weekly performance decks, e-commerce brands reconciling Facebook's ROAS with their actual revenue, and media buyers managing hundreds of active campaigns.
This guide breaks down the 10 best Facebook ads reporting tools in 2026, including their key features, Facebook-specific strengths, and pricing. You'll also find a comparison table and persona-based recommendations to help you choose the right fit.
Key Takeaways
- Facebook Ads Manager's native reporting is functional for campaigns, but it wasn't built for cross-account visibility or trend analysis at scale.
- The best Facebook Ads reporting tool for you depends on your role. Agencies need white-label automation, e-commerce brands need attribution accuracy, and media buyers need reporting that feeds directly into action.
- Most reporting tools are read-only dashboards. The real differentiator is whether the tool helps you act on what you see, or just surfaces data you then have to act on separately.
- For most advertisers just starting, Google Data Studio, paired with a free connector, is a viable option.
- If you're managing campaigns at scale, look for platforms that offer reporting and campaign management as part of the same workflow.
How These Tools Were Evaluated
To make a fair comparison among all these tools, after signing up for a free trial to test them, they were evaluated based on these criteria:
- Facebook integration depth: Focusing on whether the tool syncs in real time or batch-processes data; whether it supports creative-level and ad-level breakdown, and the amount of historical data that can be accessed.
- Report customization: Building reports from scratch vs. using available templates.
- Cross-platform support: Does the tool pull data from Google Ads, LinkedIn, and other channels, or is it limited to Meta-only
- Automation: Analyzing the report scheduling feature.
- Pricing and free tier: Comparing pricing plans and available free tiers across tools, including how many days each trial lasts.
- Ease of use: The length of the initial setup + learning curve for someone new to the platform.
The 10 Best Facebook Ads Reporting Tools in 2026
1. TheOptimizer
Best for: Media buyers who need a centralized dashboard and do not want to toggle between a reporting tool and a management platform
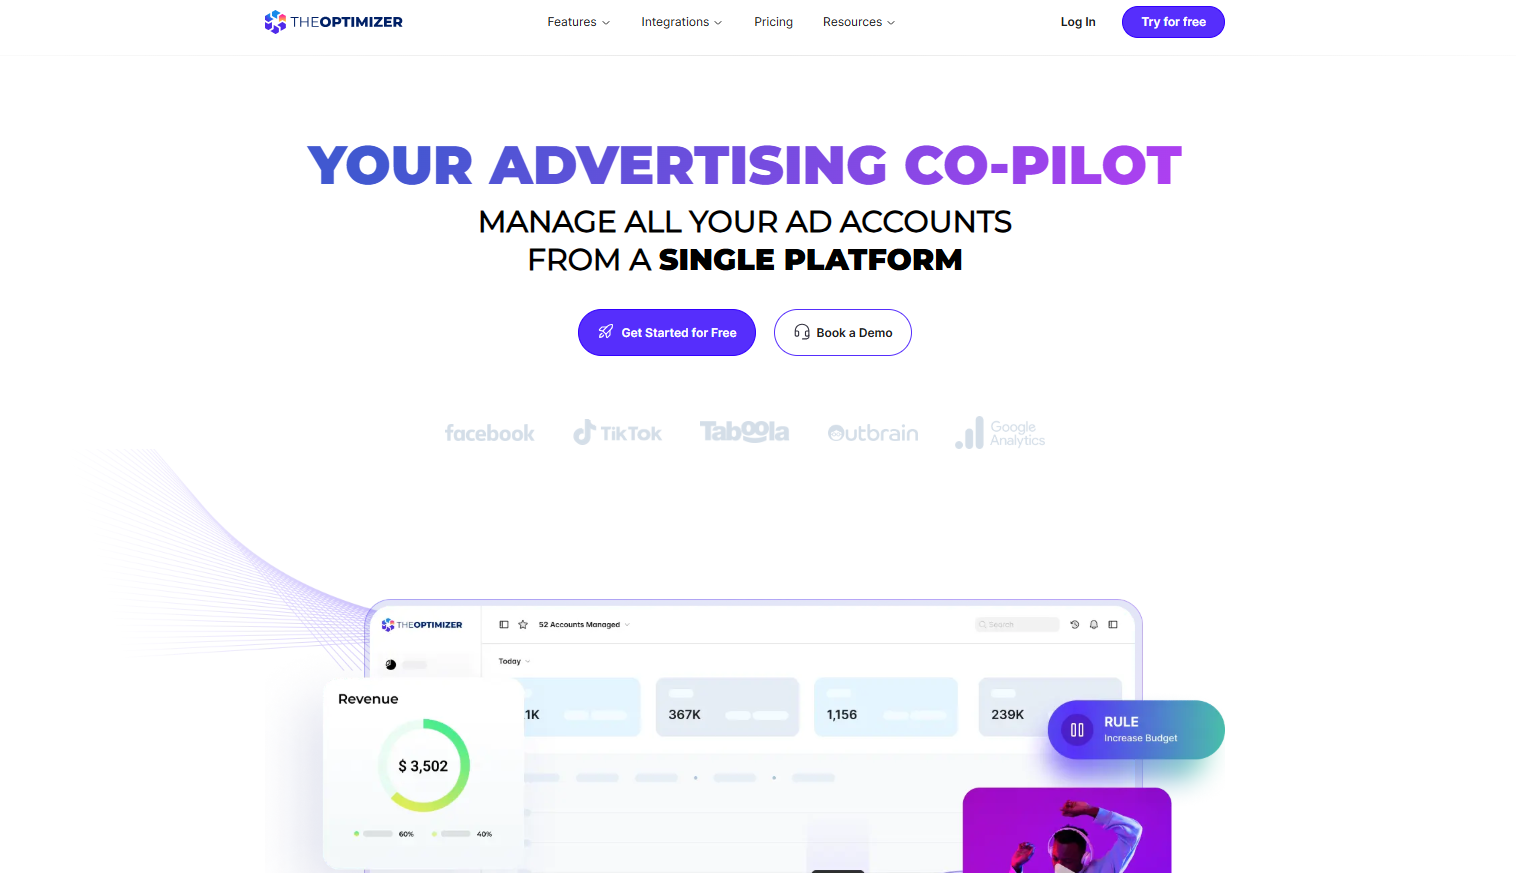
The first thing you notice when you land in TheOptimizer is that reporting isn't a separate tool, but it's built directly into the same interface you use to manage campaigns, set automation rules, and control bids.
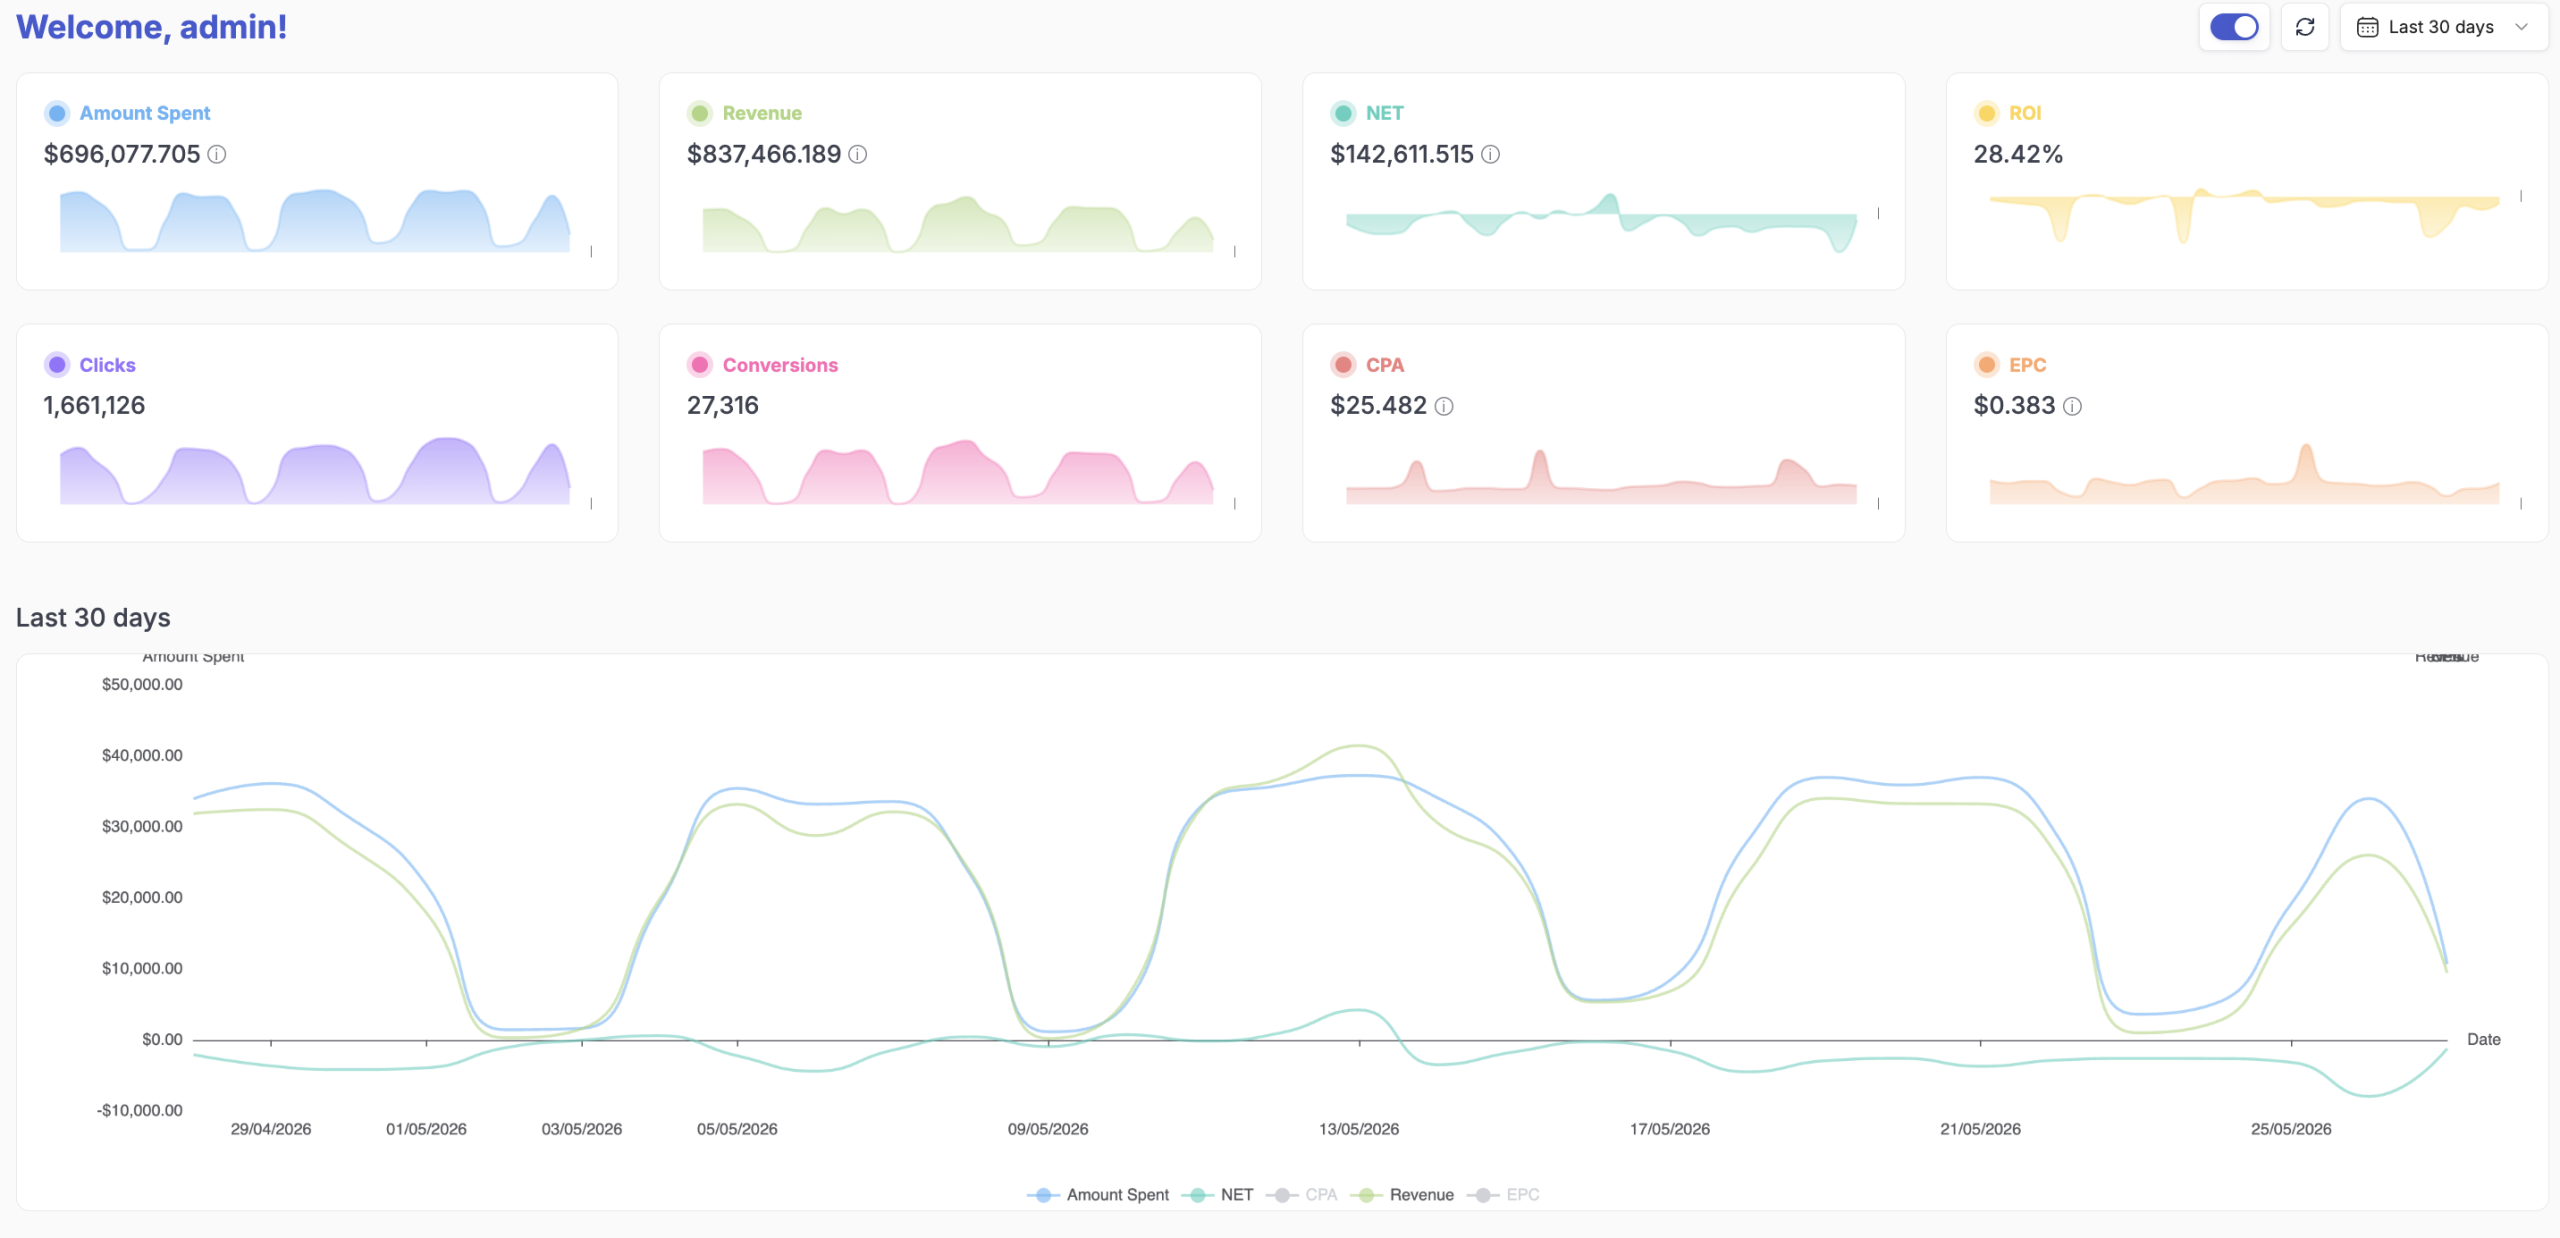
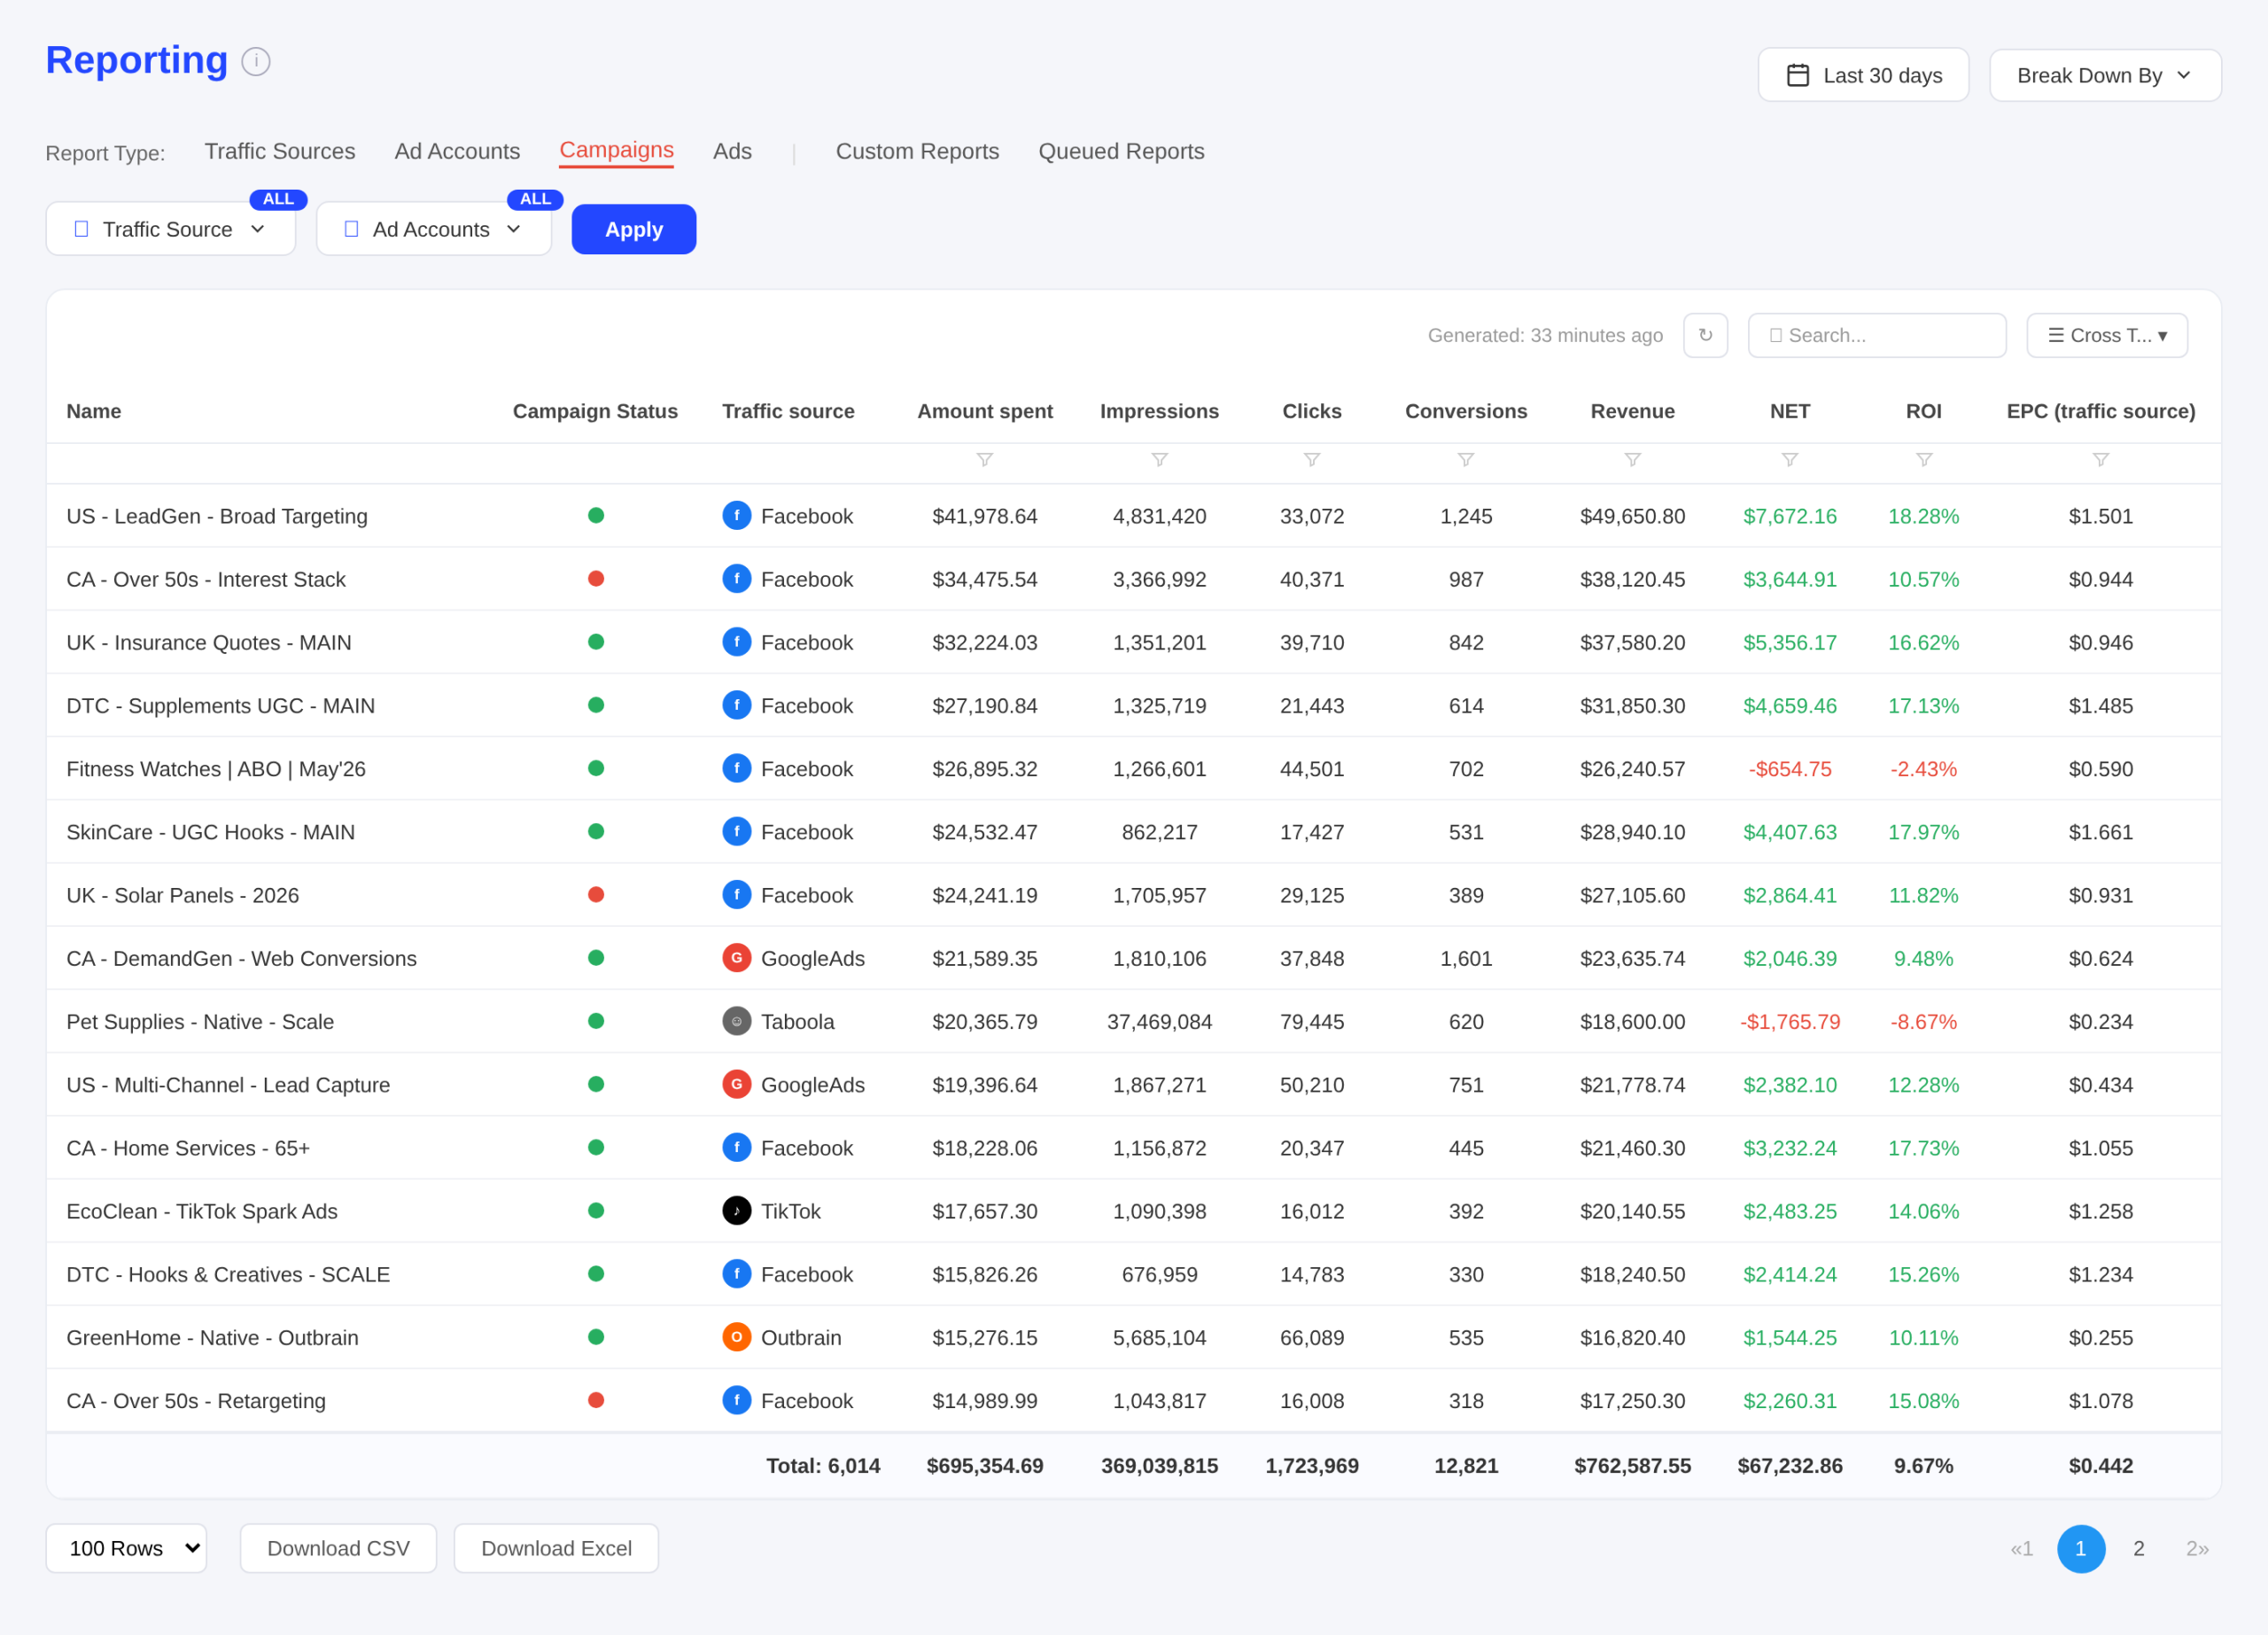
When you navigate to the Reporting section, you see that the reports are organized by type: Traffic Sources, Ad Accounts, Campaigns, Ads, Custom Reports, and Queued Reports. Each view serves a different layer of analysis, and switching between them takes a single click.
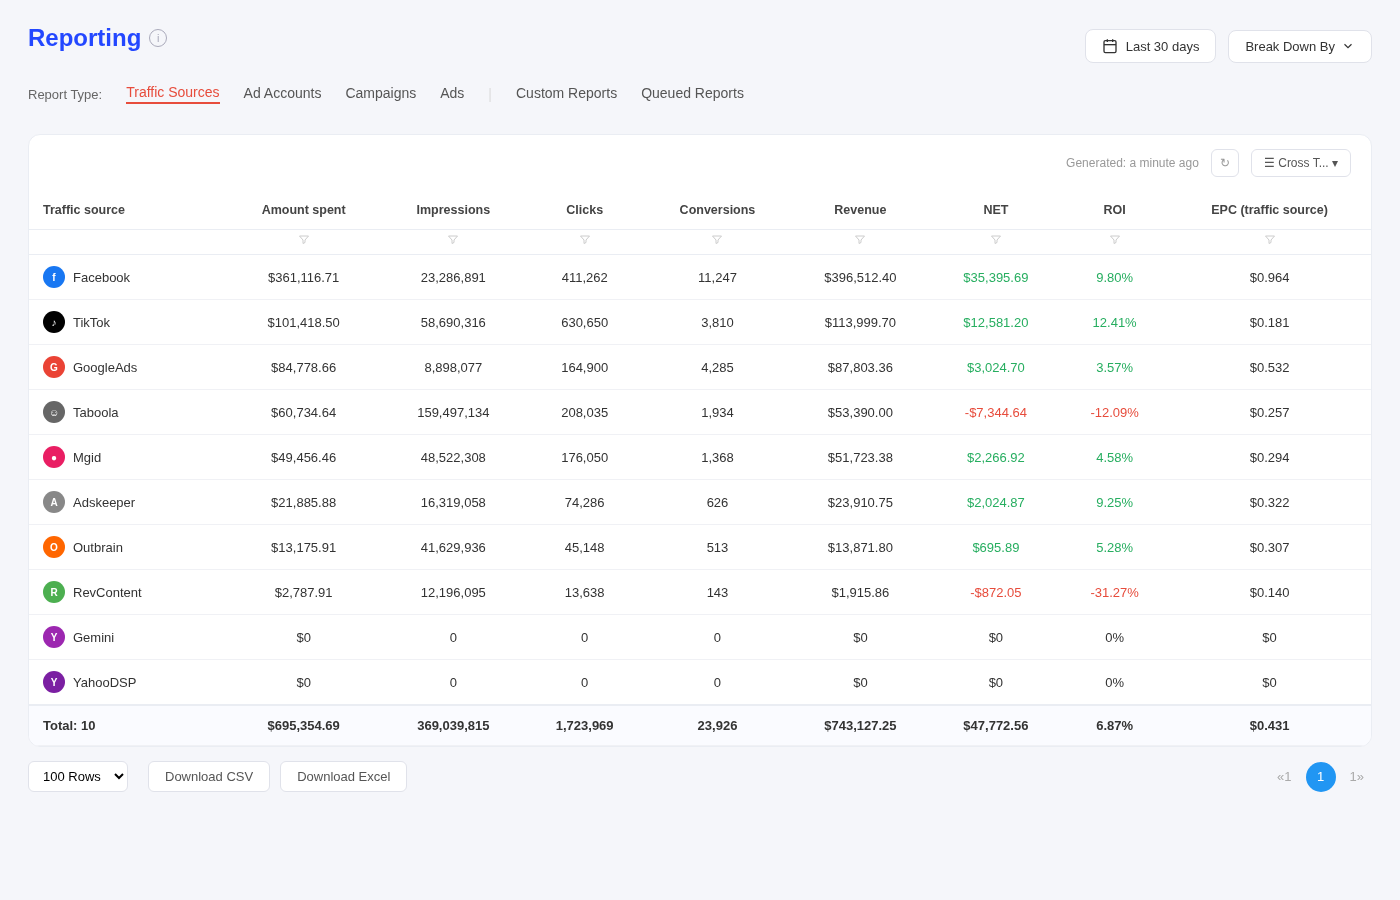
The Traffic Sources view gives you a cross-platform breakdown (spend, impressions, clicks, conversions, revenue, NET, ROI, and EPC) across every network you're running.
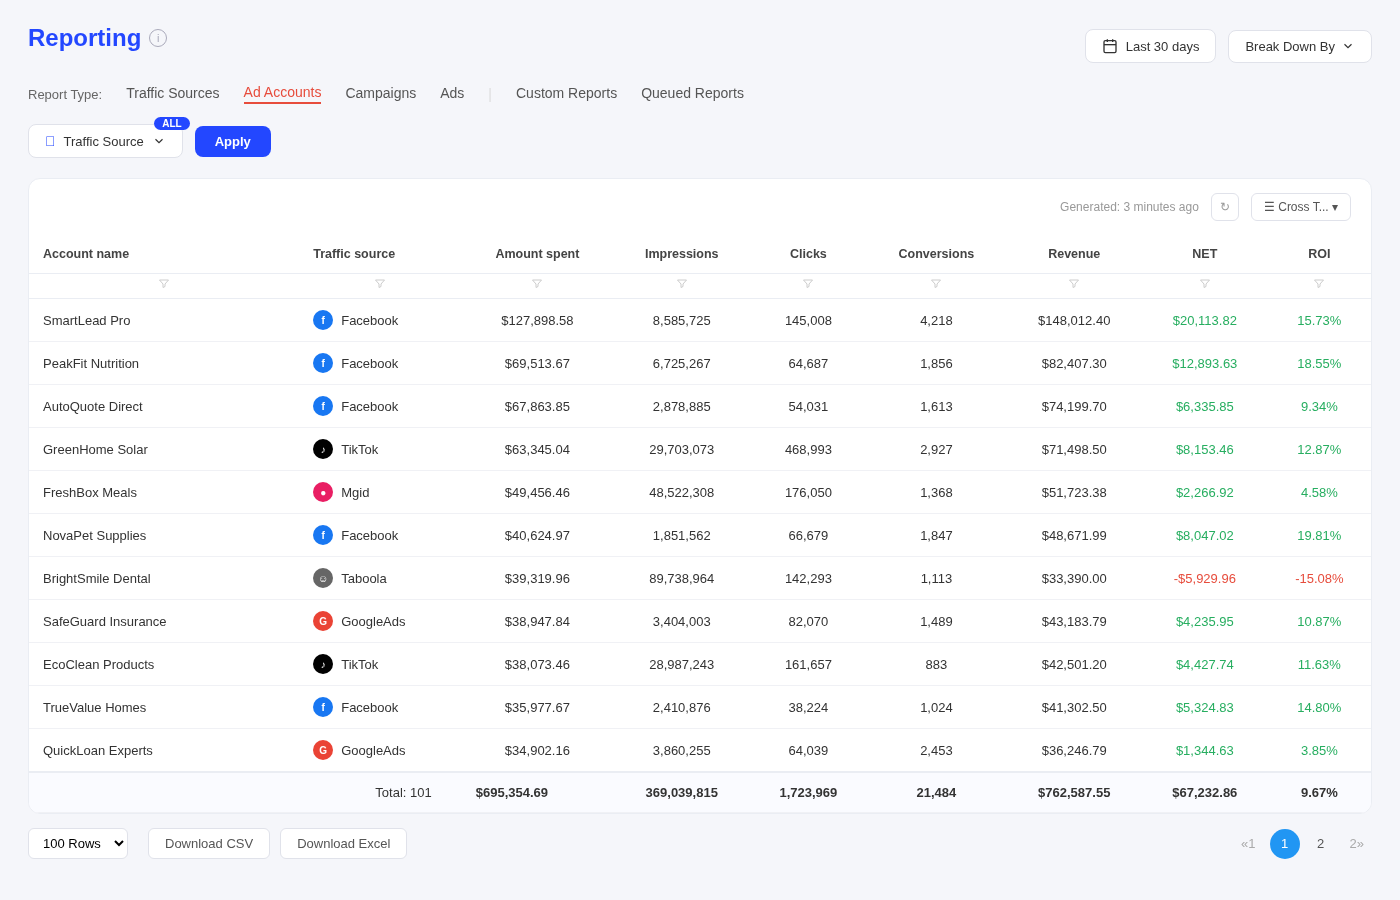
If you switch to Ad Accounts, the same metrics are broken out by individual account, with traffic source visible alongside each one. You can filter by traffic source and apply it across all accounts simultaneously.
The Campaigns view goes deeper. Every campaign is listed with its status, ID, account ID, traffic source, and performance metrics.
The Ads view is where TheOptimizer's reporting separates itself from many other tools that serve the same function.
You can see performance at the individual creative level, with a content preview of the actual ad copy, Ad Status, ID, Account ID, Traffic Source, Amount Spent, Impressions, and Clicks across different ads in a single, searchable view.
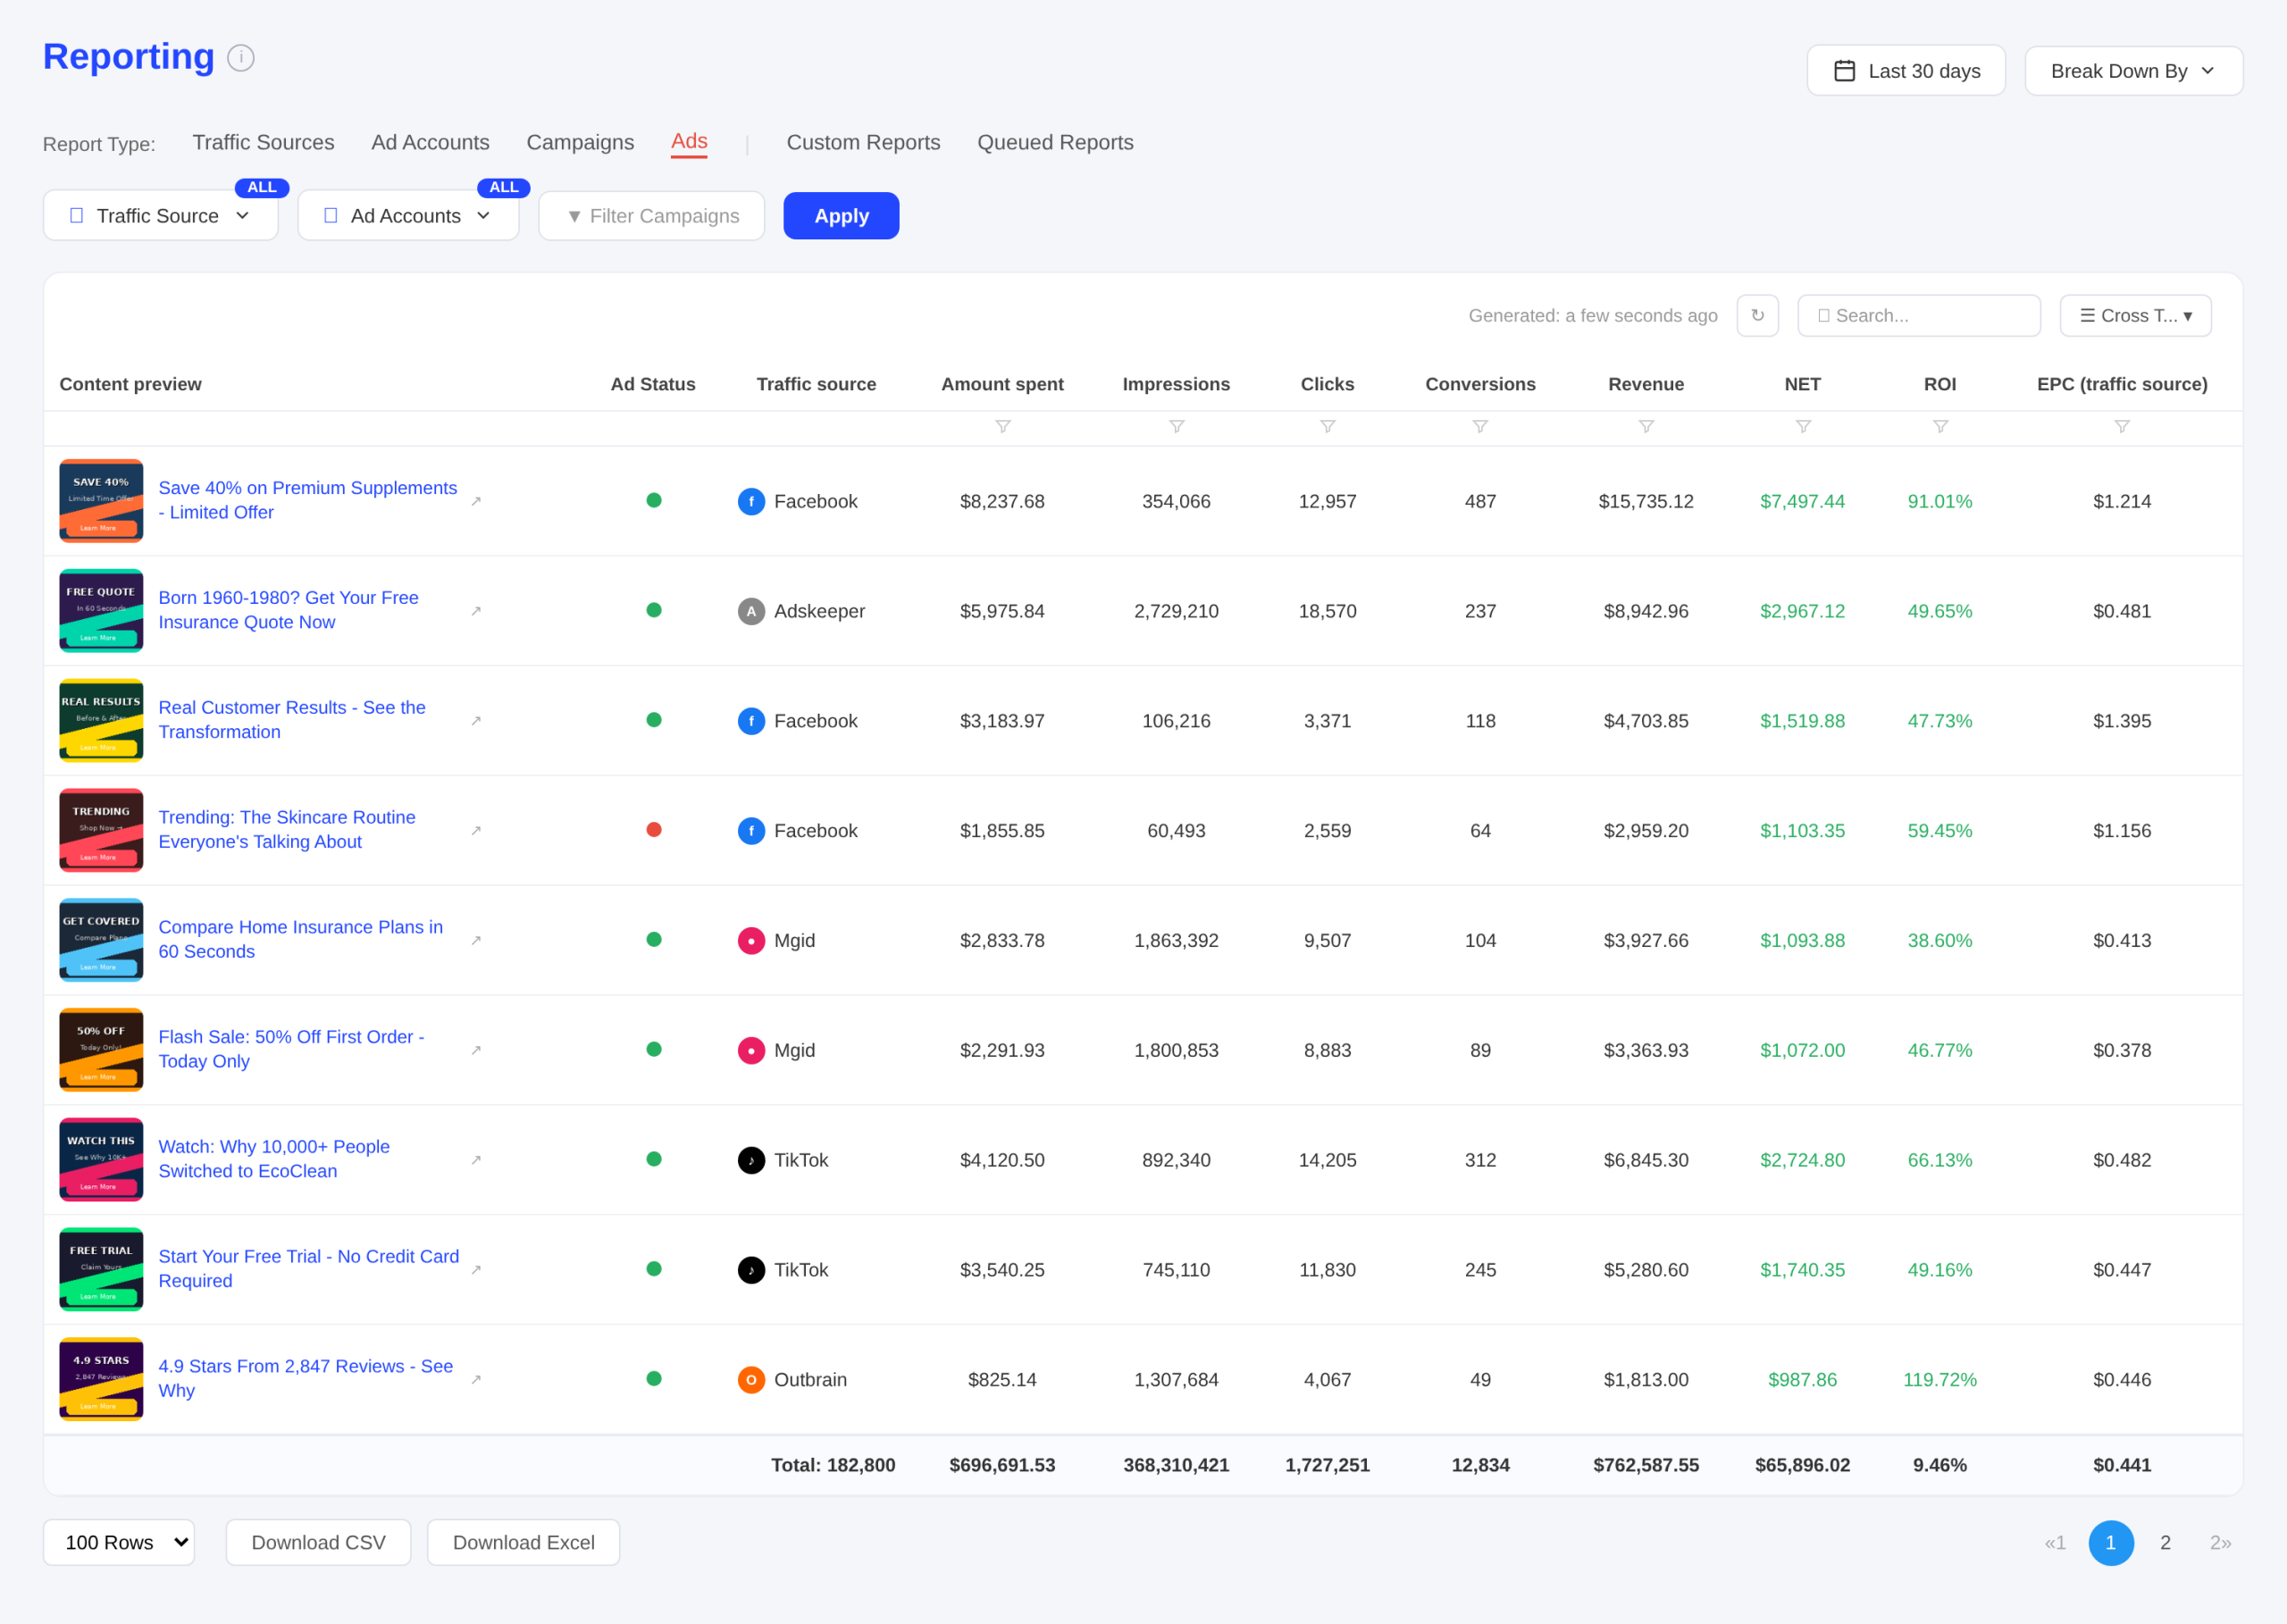
Once you have the view you need, you can download CSV or download Excel, directly from the reporting table.
TheOptimizer's reporting covers three layers that most tools don't:
- Ad Creative Reporting: Sort reports by creative across all campaigns simultaneously, spot winning creatives faster, and identify patterns without manually cross-referencing campaign by campaign. Scaling decisions become much simpler based on this data.
- Publisher Site Reporting: For native advertising platforms, you can filter by publisher site across all ad accounts, identify consistently underperforming placements, and block them directly via automation rules.
- Custom Reports: Build reports at the ad group, ad set, publisher site, section, or any other campaign level, selecting only the metrics that matter and applying filters to zero in on specific campaigns or accounts.
Key features
- Cross-platform performance overview
- Per-creative analytics tied directly to campaign management
- Rule activity logs
- Campaign performance trends with actionable context
- Integrated optimization
Facebook-specific strengths
The integration between reporting and automation is the differentiator. When you see a creative's CPA trending upward in the dashboard, you can immediately update the rule managing that creative's budget.
Pricing
Included with TheOptimizer subscription. Pricing starts from $199/month.
Free tier: 15-day free trial
Bottom line
If you're a high-volume media buyer who already uses or is considering automation tools, TheOptimizer's reporting removes an entire tool from your stack while adding a layer of integration no standalone reporting tool can match.
2. Supermetrics
Best for: Automating Facebook Ads data transfers into Google Sheets, Google Data Studio, or any BI tool
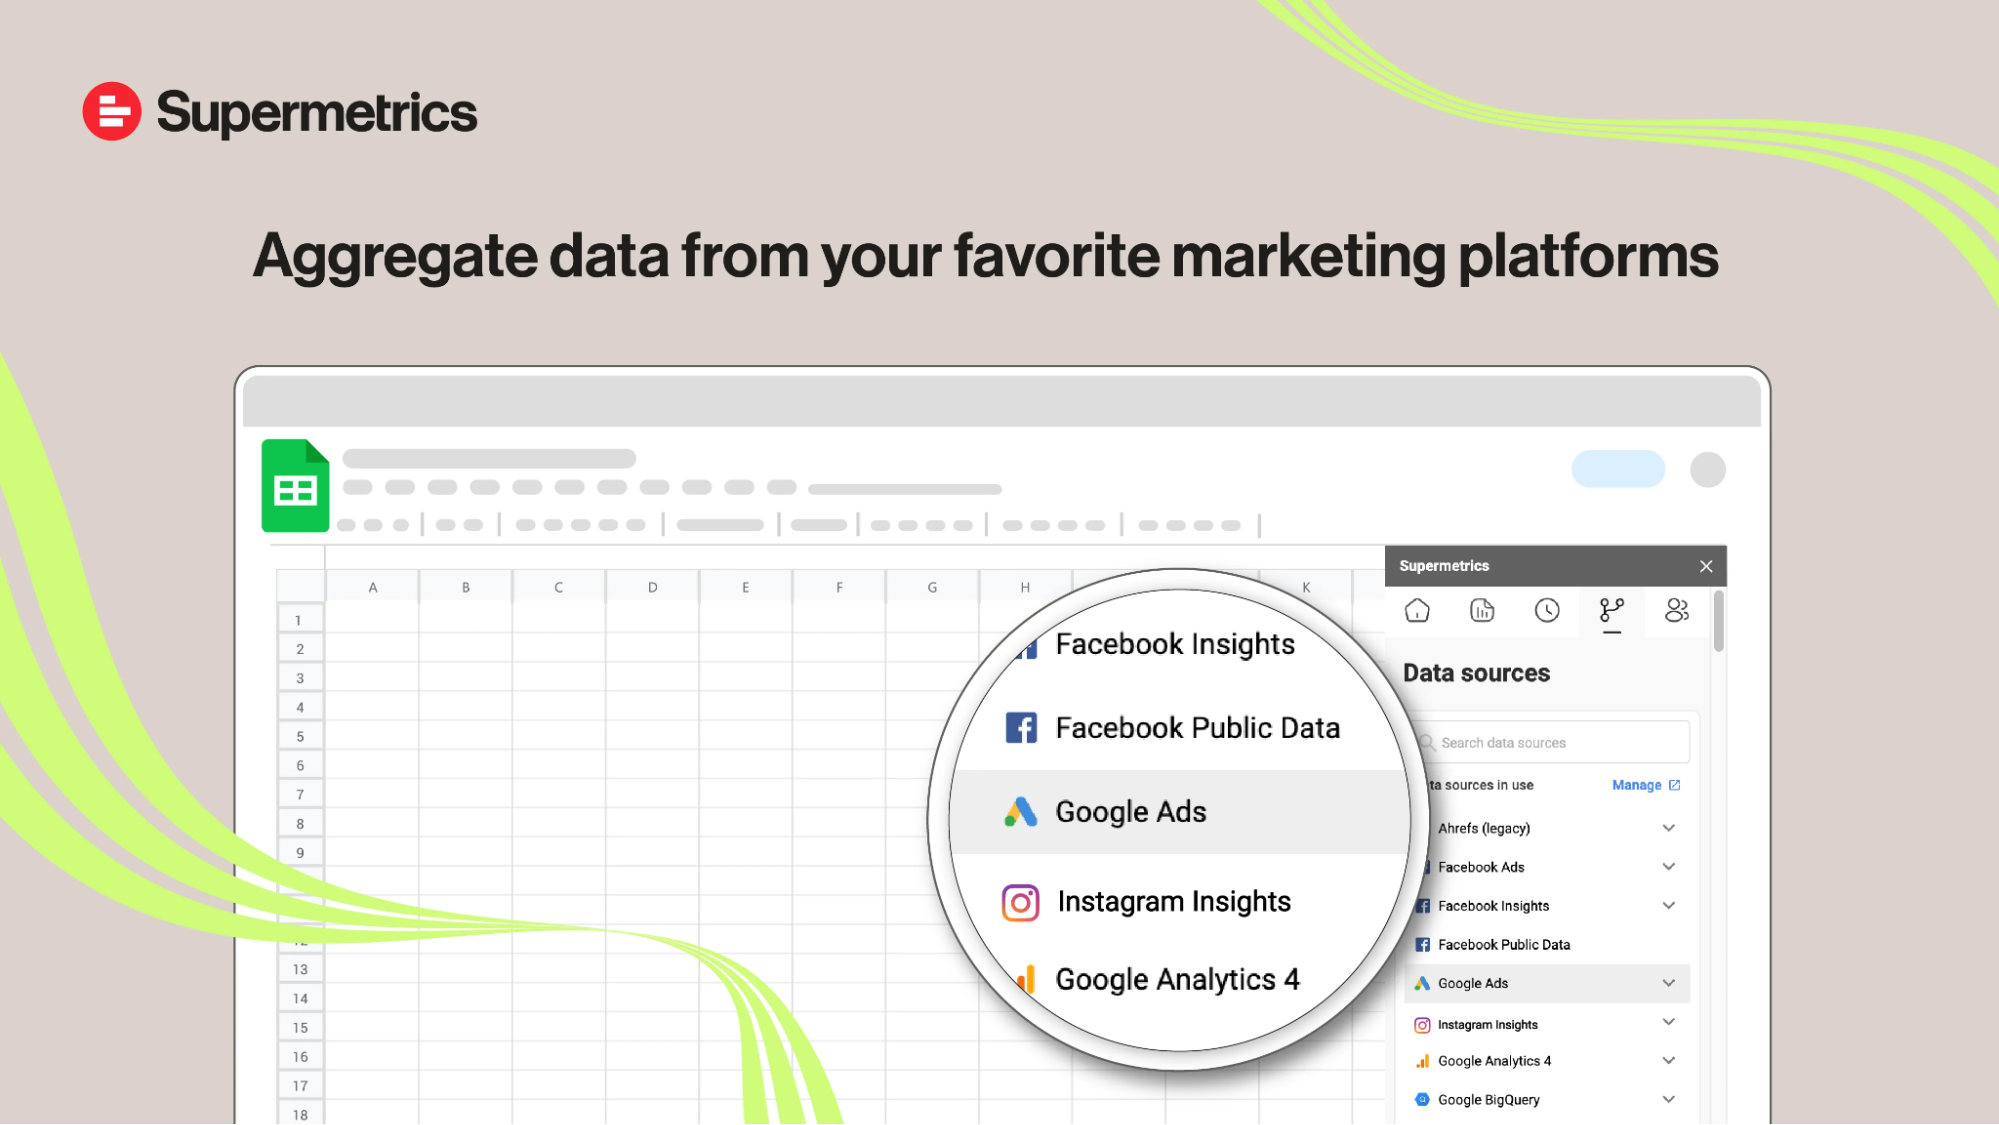
Image source: G2
If you already live in Google Sheets, Google Data Studio, or Excel, and want Facebook Ads data flowing in automatically, Supermetrics does just that.
It's not a reporting platform per se, more like a pipeline that delivers your data wherever you actually need it.
When testing, I found the platform's setup simple. After naming the team, I was dropped into a data source connection screen with hundreds of integrations available, from Facebook Ads to LinkedIn, and other platforms.
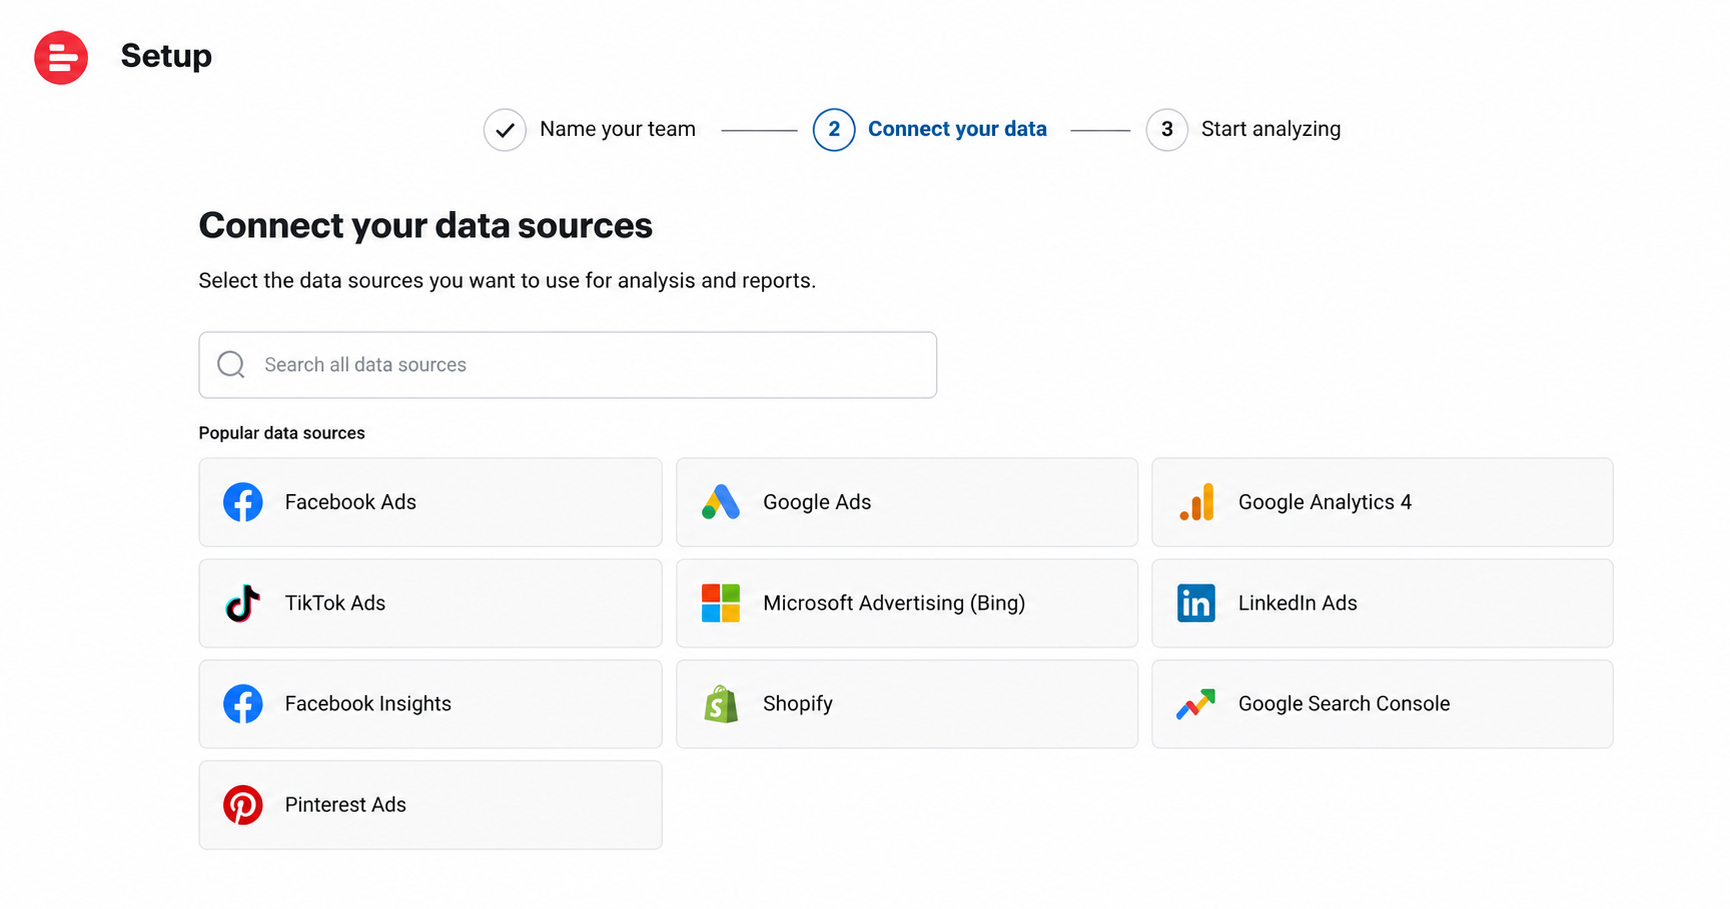
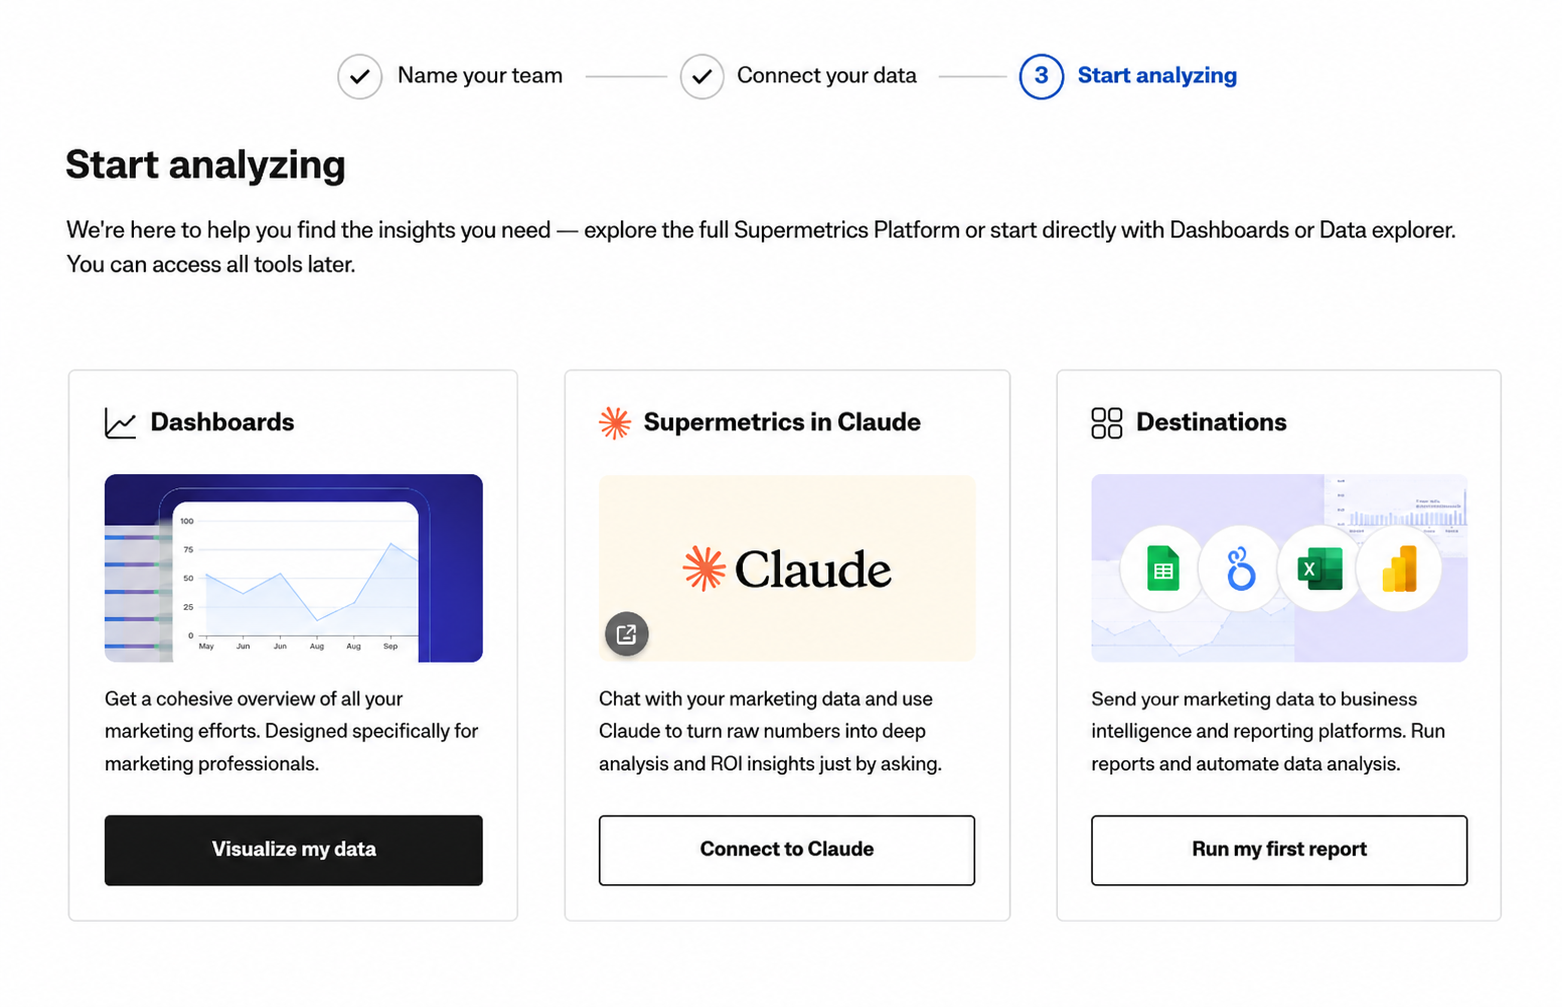
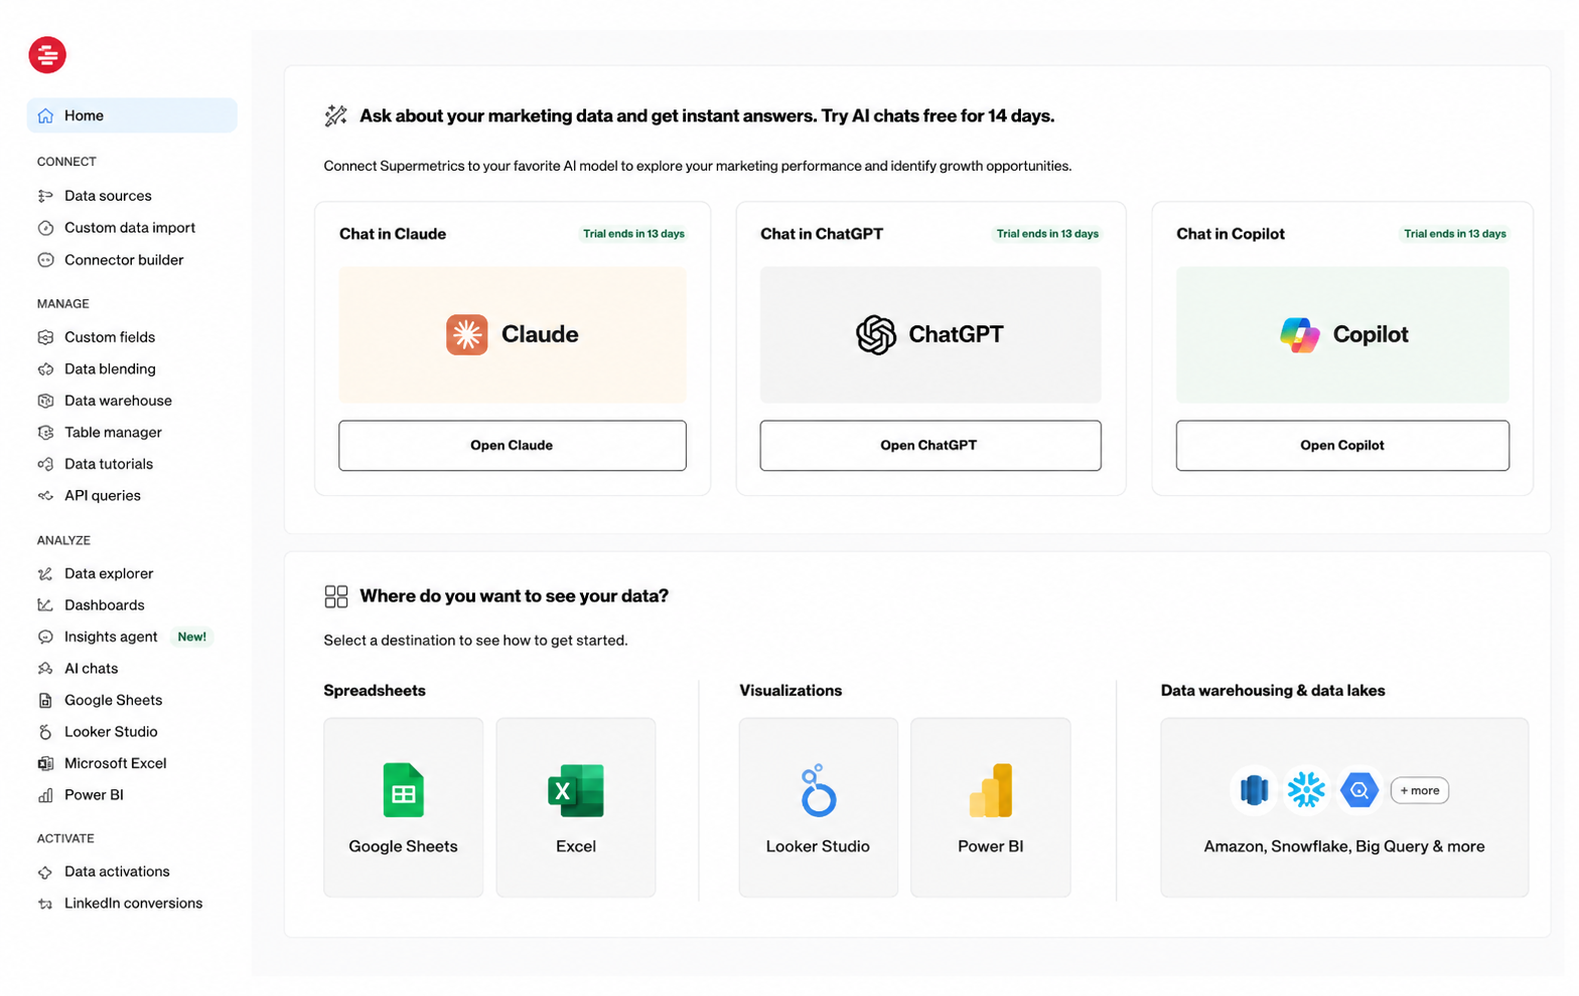
Once the data source is connected (I connected it to Facebook Ads), Supermetrics gives you three paths forward: build a Dashboard inside the platform, connect your data to Claude (yes, you can literally chat with your marketing data), or pipe everything to an external Destination like Google Sheets, Excel, Power BI, or a data warehouse.
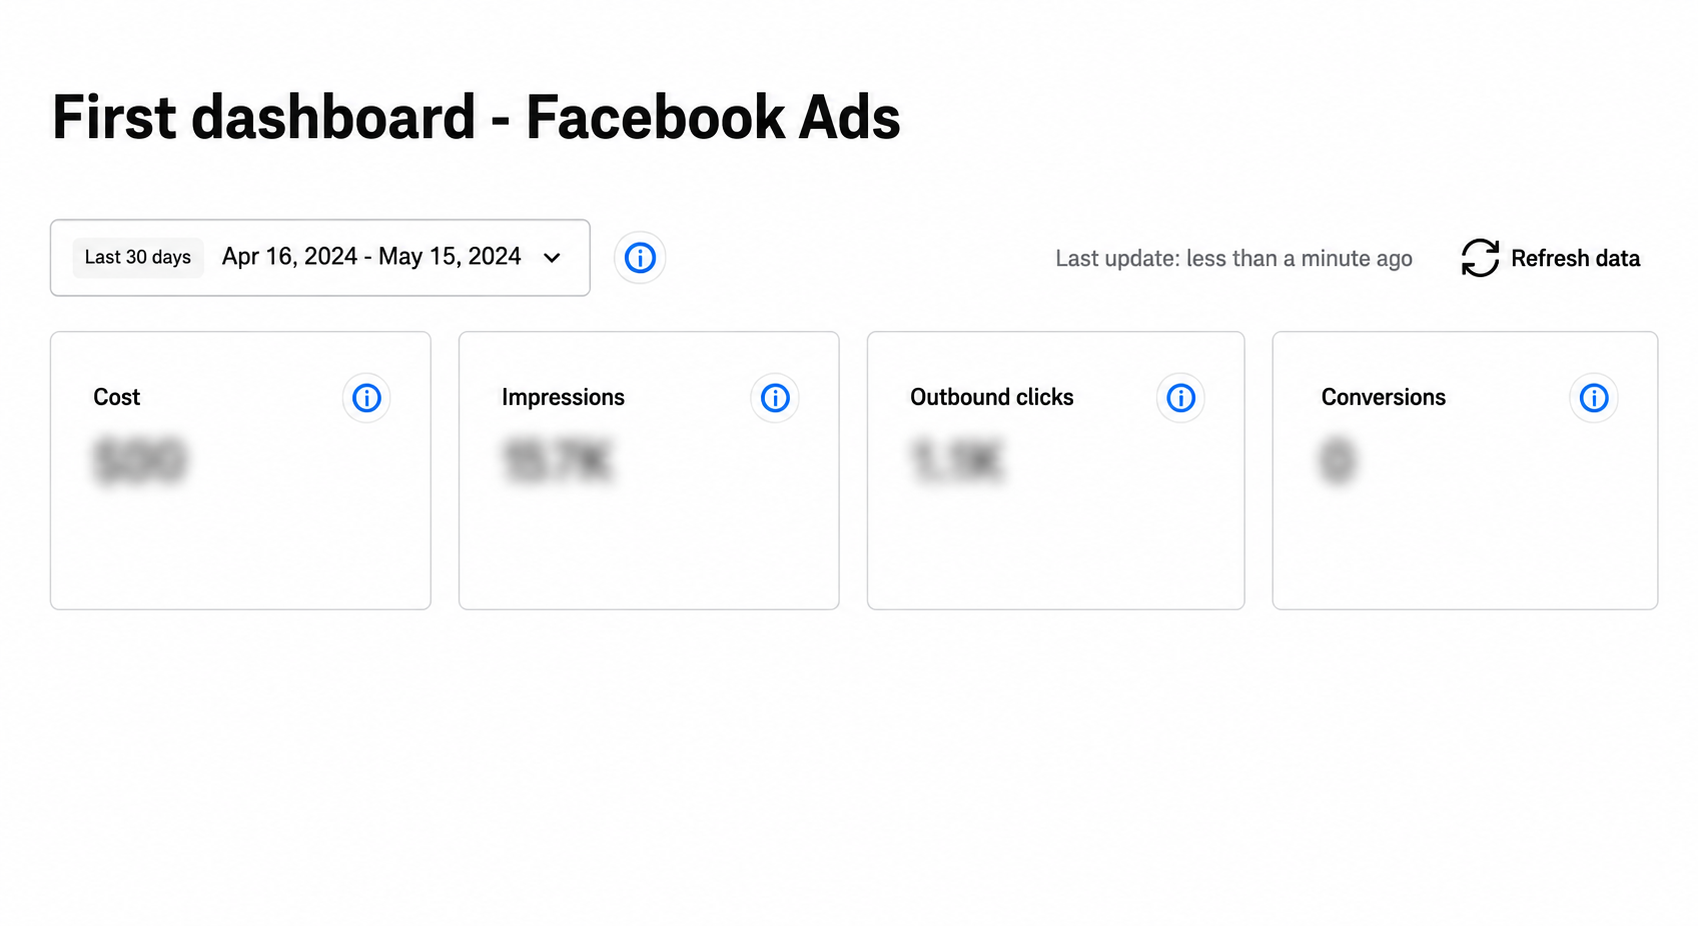
I chose to visualize my data first, clicked into the Dashboards option, and within seconds had a live Facebook Ads dashboard pulling real metrics: Cost, Impressions, Outbound Clicks, and Conversions (in this case for the last 30 days) synced and timestamped.
Supermetrics has built out an entire analytics layer, with alternatives to direct connectors to every major destination you'd need.
Key features
- 100+ data source connectors
- Custom query builder with granular breakdown dimensions
- You can pull up to 24 months of past performance
- Multi-account support across ad accounts and pages
- Native integrations with AI tools, + Sheets, Google Data Studio, Excel, BigQuery, and Snowflake
Facebook-specific strengths
Supermetrics goes deeper than Ads Manager ever will on breakdown dimensions. You can pull cost data at the creative level, toggle attribution windows, and segment by placement or audience without exporting a single CSV.
Pricing
Starts at €49 ($57) when billed monthly.
Free tier: 14-day free trial
Bottom line
The onboarding is simple for a tool that is, at its core, infrastructure. In just three steps, you'll have a live Facebook Ads dashboard pulling real data. The AI chat integration allows you to get deep insights into your campaign.
3. Google Data Studio (Formerly Looker Studio)
Best for: Free custom dashboards
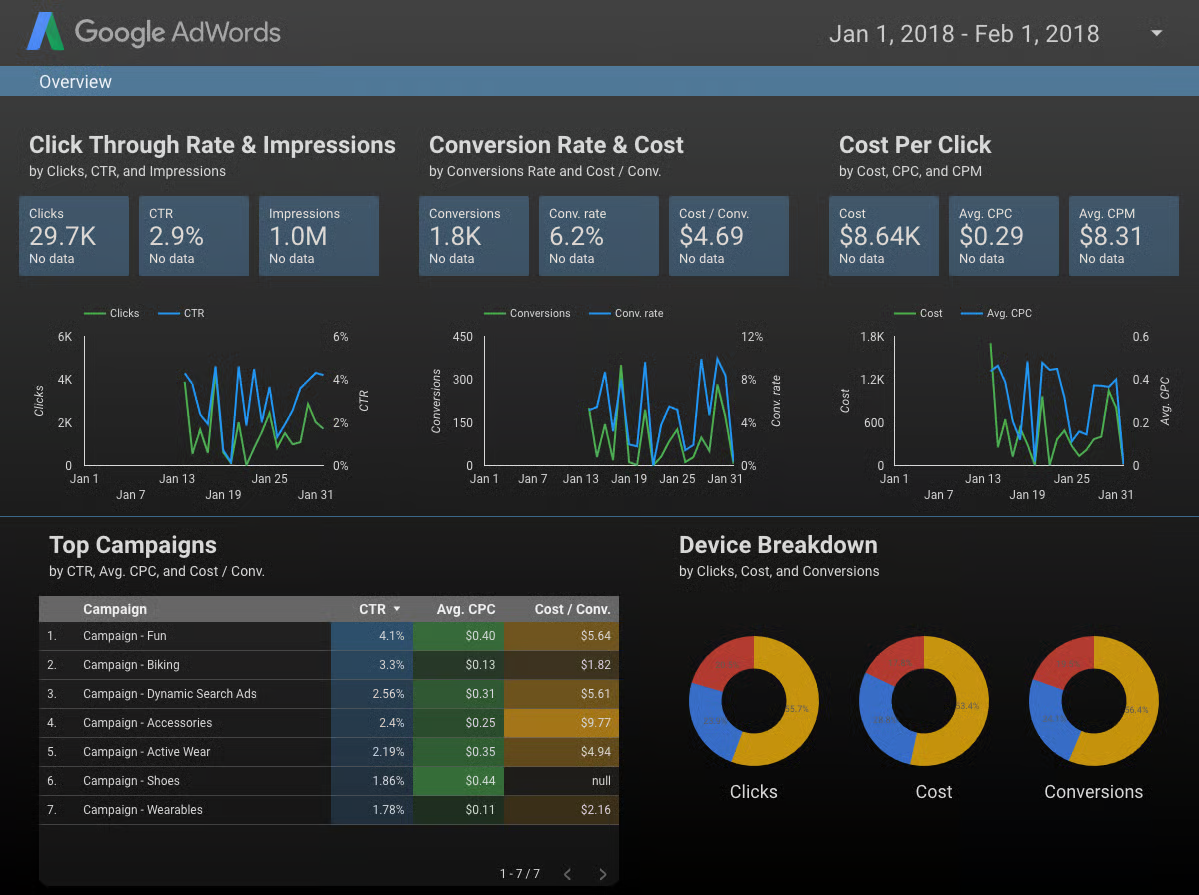
Image source: G2
Google Data Studio is the most powerful free reporting tool available to advertisers. It's a drag-and-drop dashboard builder that connects thousands of data sources, allows live URL sharing, and can be set up to deliver email snapshots.
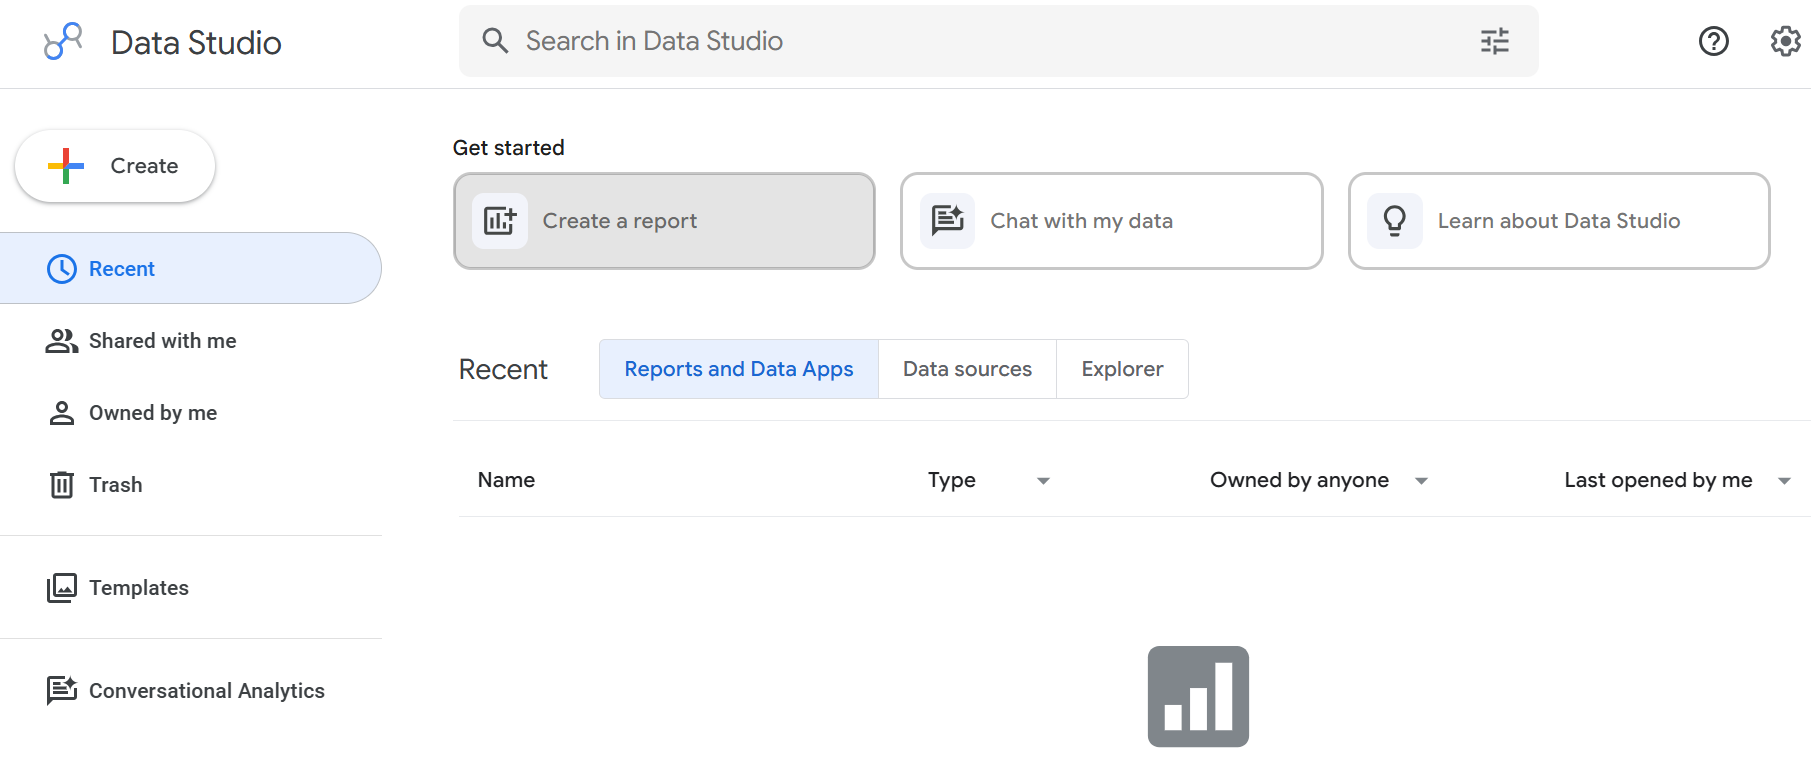
There's a catch, though. Data Studio doesn't connect natively to Facebook Ads. You need a third-party connector, like Supermetrics, to pull Meta data in.
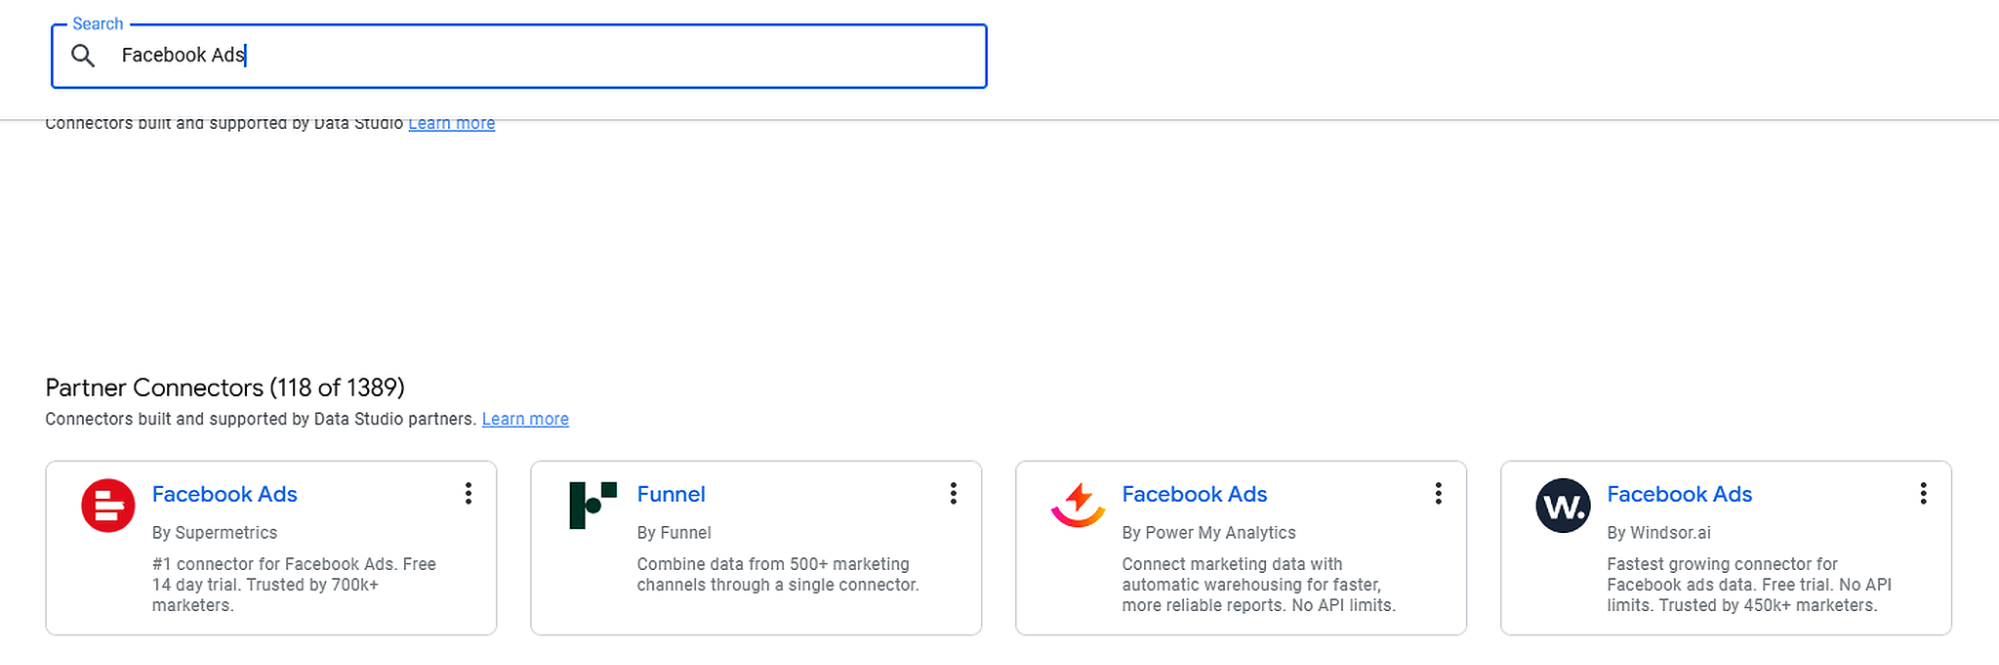
So, after choosing Facebook Ads as your source of connection, you'll also need to connect it to Supermetrics.

Once you authenticate your Facebook account, Supermetrics manages the connection and pipes your ad data directly into Google Data Studio. From there, your campaigns, spend, CTR, and conversions are live and ready to visualize.
Key features
- Drag-and-drop report builder with charts, tables, scorecards, and filters
- Shareable via link, no login required for viewers
- Scheduled email delivery for reports
- Blended data sources (Facebook + Google Ads in the same chart)
- Hundreds of community-built templates
Facebook-specific strengths
Once connected, Google Data Studio excels at cross-platform dashboards. Seeing Facebook CPM alongside Google CPM, or Facebook ROAS next to TikTok ROAS, in a single view is where it earns its keep.
Pricing
Free
Bottom line
If you don't have a budget, Google Data Studio, plus a free Facebook connector, gets you 80% of what paid tools offer.
4. AgencyAnalytics
Best for: Agencies managing multiple clients
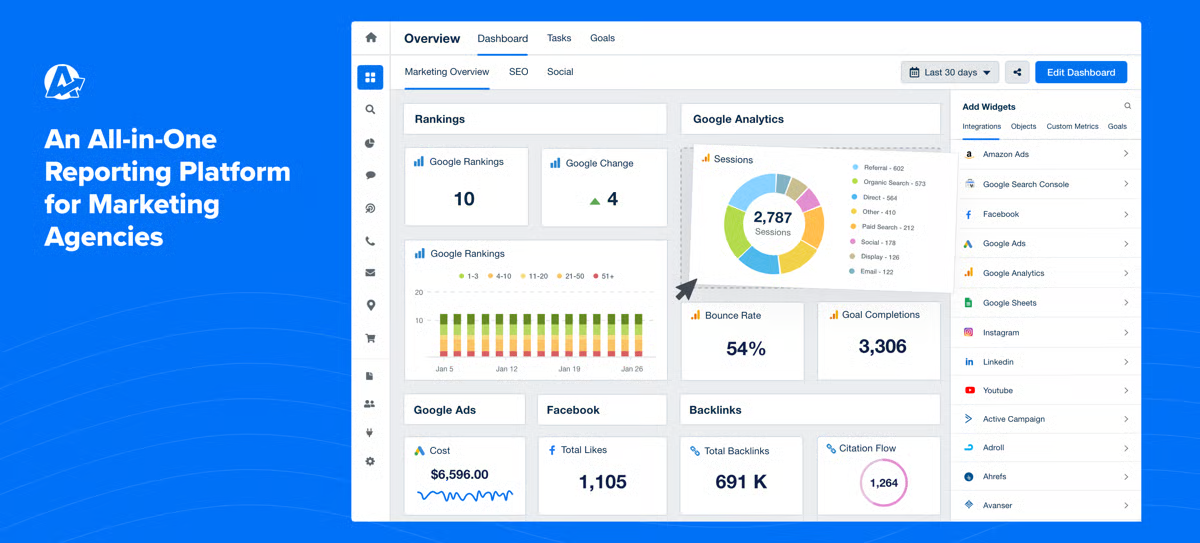
Image source: G2
AgencyAnalytics is purpose-built for client reporting at scale. If you're managing many client accounts and sending weekly performance reports, this is the tool that makes that workflow sustainable.
The core value prop is white-labeling. Your logo, domain, color scheme, and everything that represents your brand identity are what the client sees.
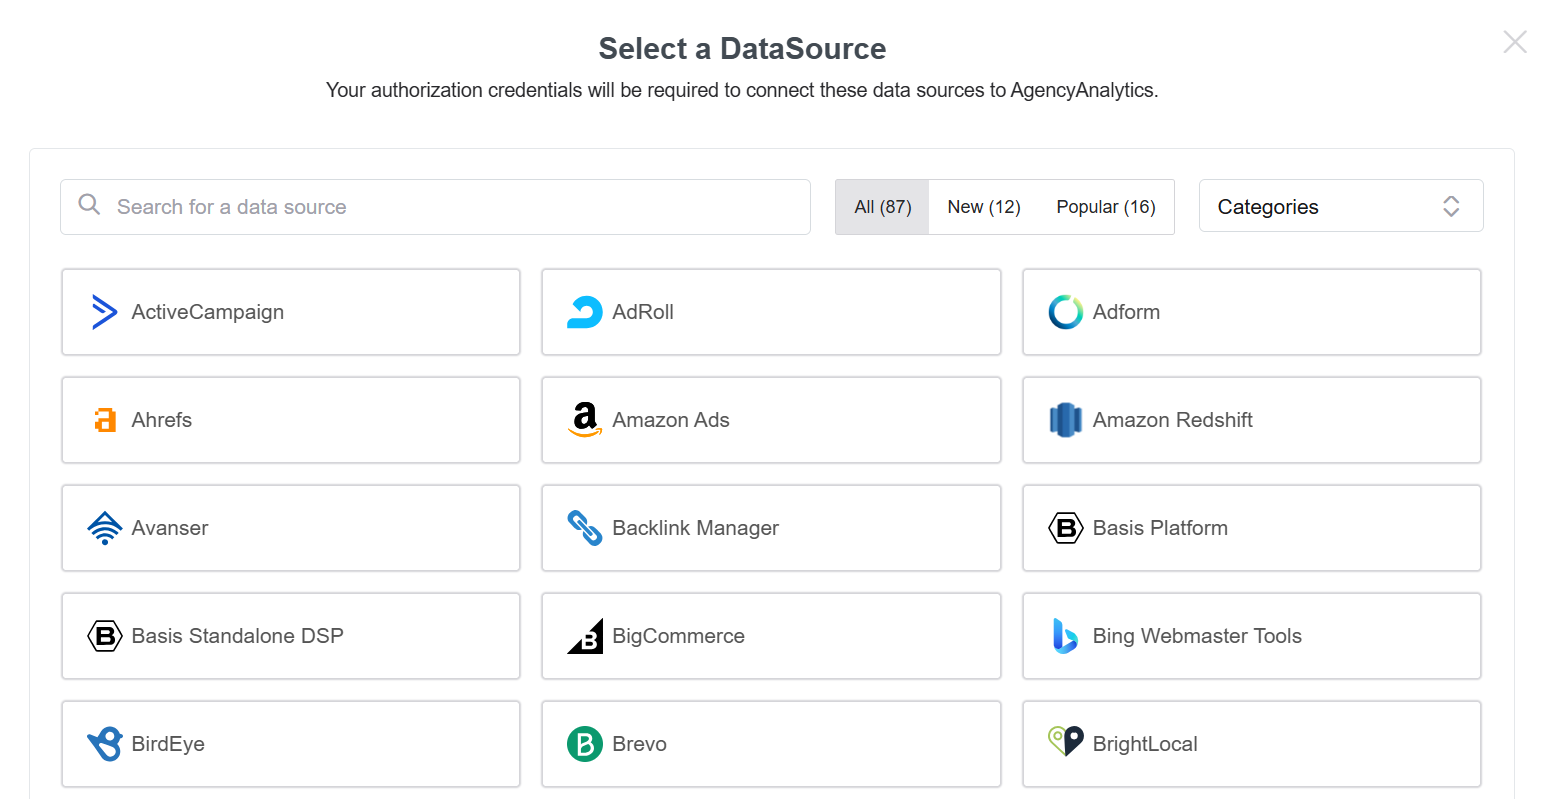
The setup follows a familiar pattern, as in other Facebook Ads reporting tools. You're first asked to select a data source from a library of available integrations.
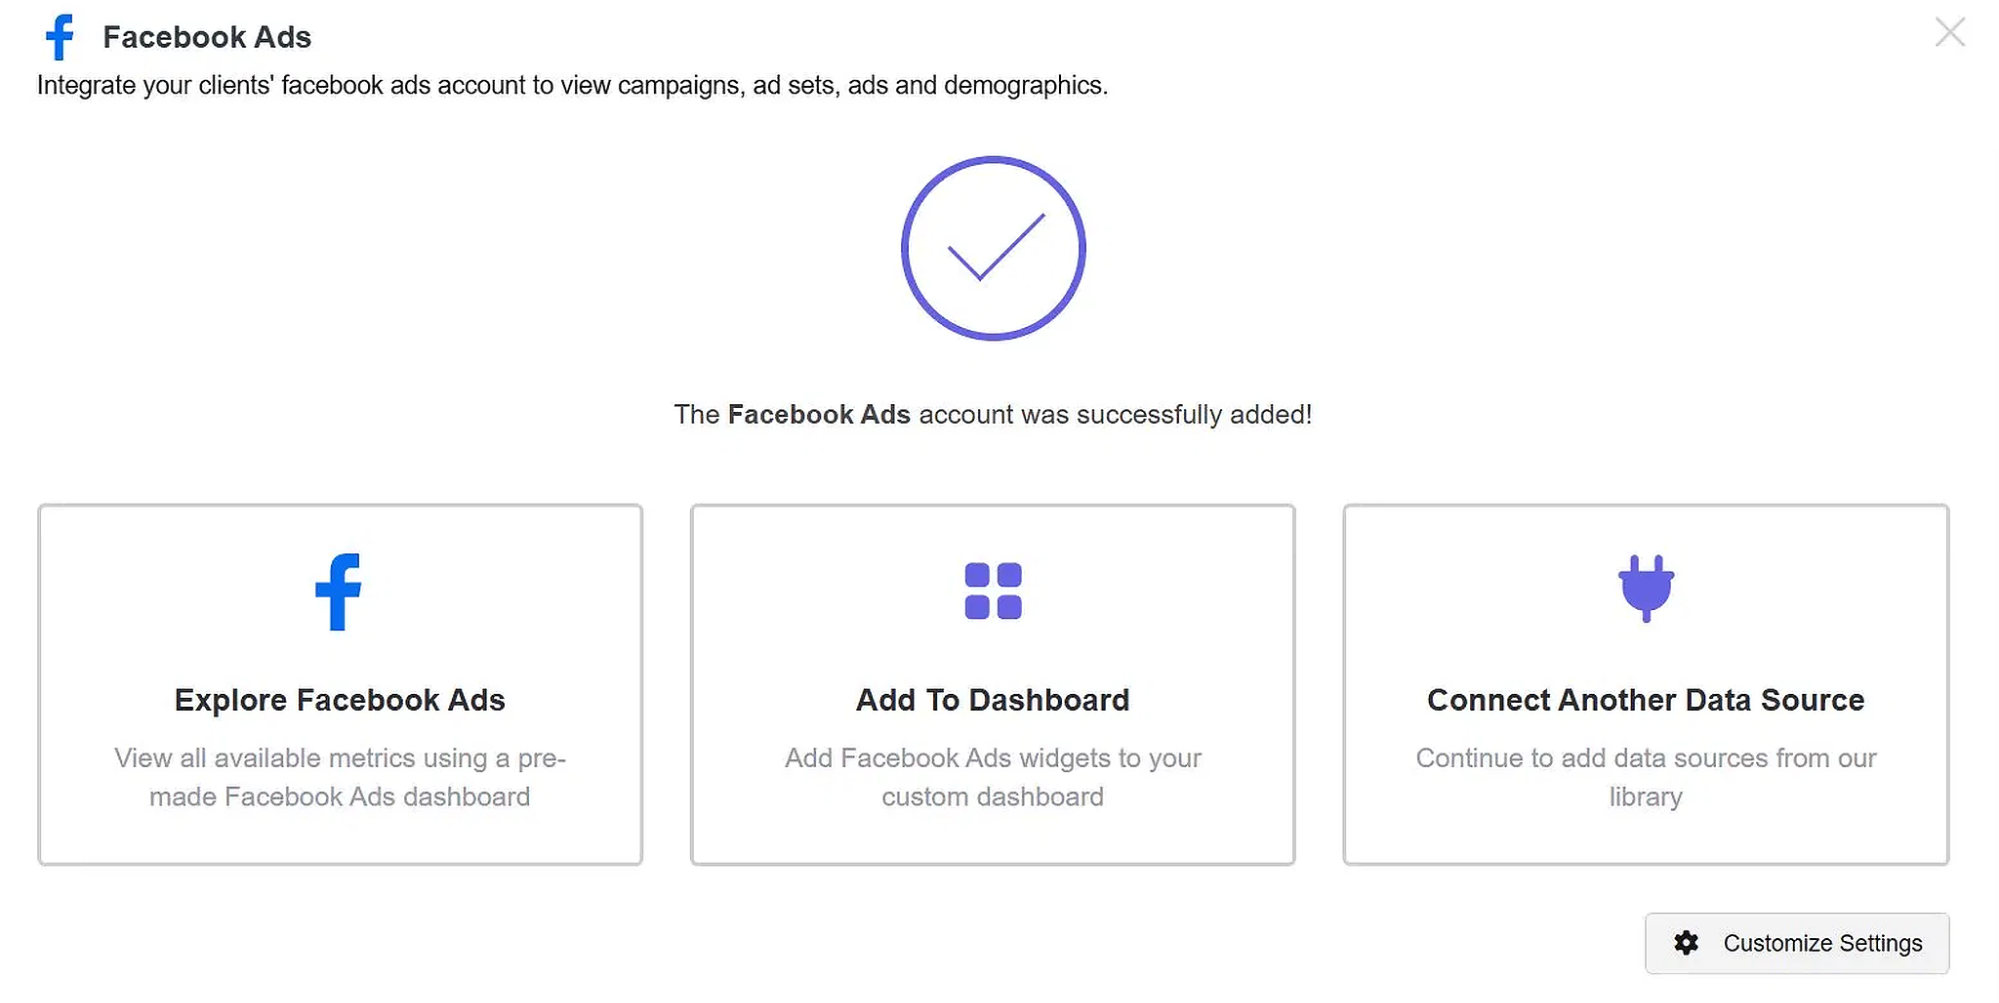
Once connected, the confirmation screen gives you three immediate paths: explore your Facebook Ads data using a pre-made dashboard, add Facebook Ads widgets to a custom dashboard you're already building, or connect another data source on top of it.
When you're ready to build a dashboard, AgencyAnalytics gives you four starting points: a blank canvas, a Smart Dashboard, a premade template, or a clone of an existing dashboard.
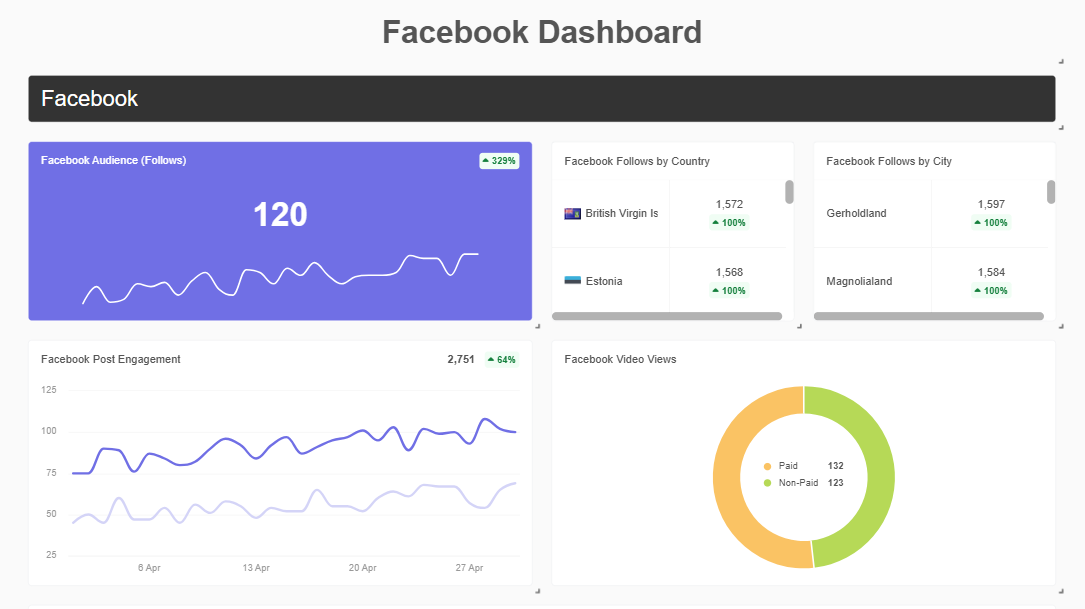
After it's generated, the Facebook Ads report looks like this:
Beyond dashboards, AgencyAnalytics lets you schedule automated report delivery.
Key features
- White-label reports and client dashboards (custom domain, logo, colors)
- 80+ integrations
- Pre-built Facebook Ads report templates with campaign and ad-level breakdowns
- Scheduled automated delivery (daily, weekly, monthly)
- Client management portal
Facebook-specific strengths
The pre-built Facebook Ads templates are well-designed (spend, impressions, CTR, CPA, ROAS broken out by campaign, ad set, and creative). For agencies that need to look polished without building reports from scratch, this is a great tool.
Pricing
Starts at $20 per client per month.
Free tier: 14-day trial
Bottom line
The best dedicated client reporting tool for agencies. If you manage more than five clients, the time it saves alone makes it a no-brainer.
5. DashThis
Best for: Simple, beautiful client reports with minimal setup
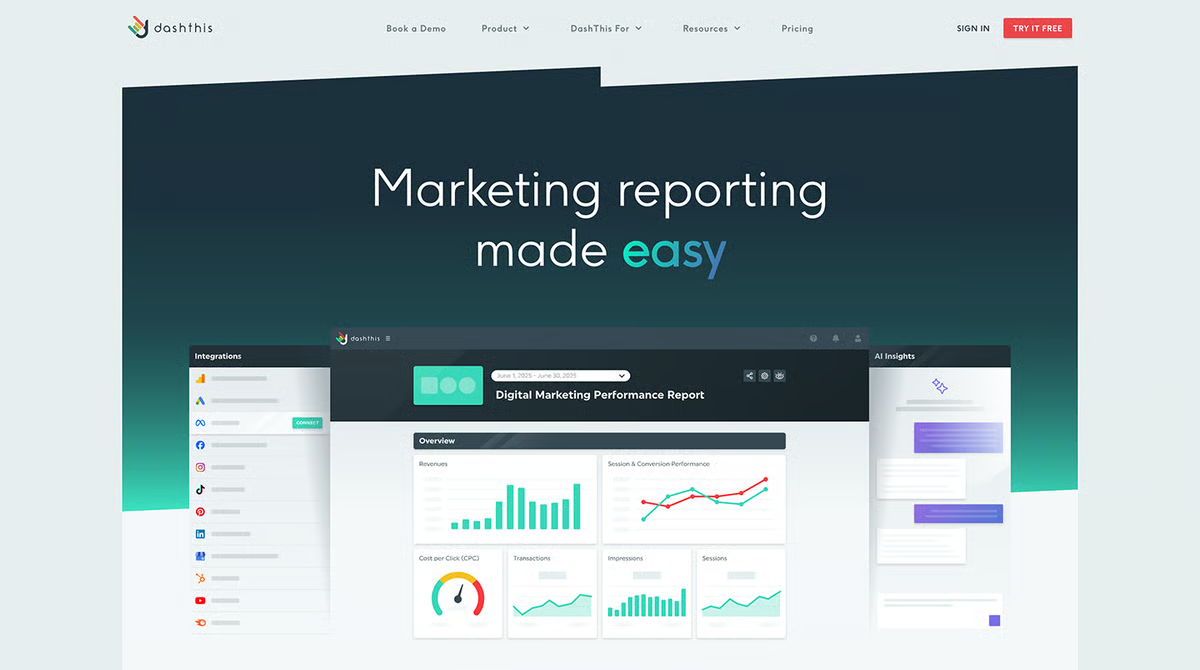
Image source: G2
DashThis reporting is a feature used by agencies that want clear reports out the door with as little friction as possible.
The interface is intentionally simple, and the output looks polished without requiring design skills.
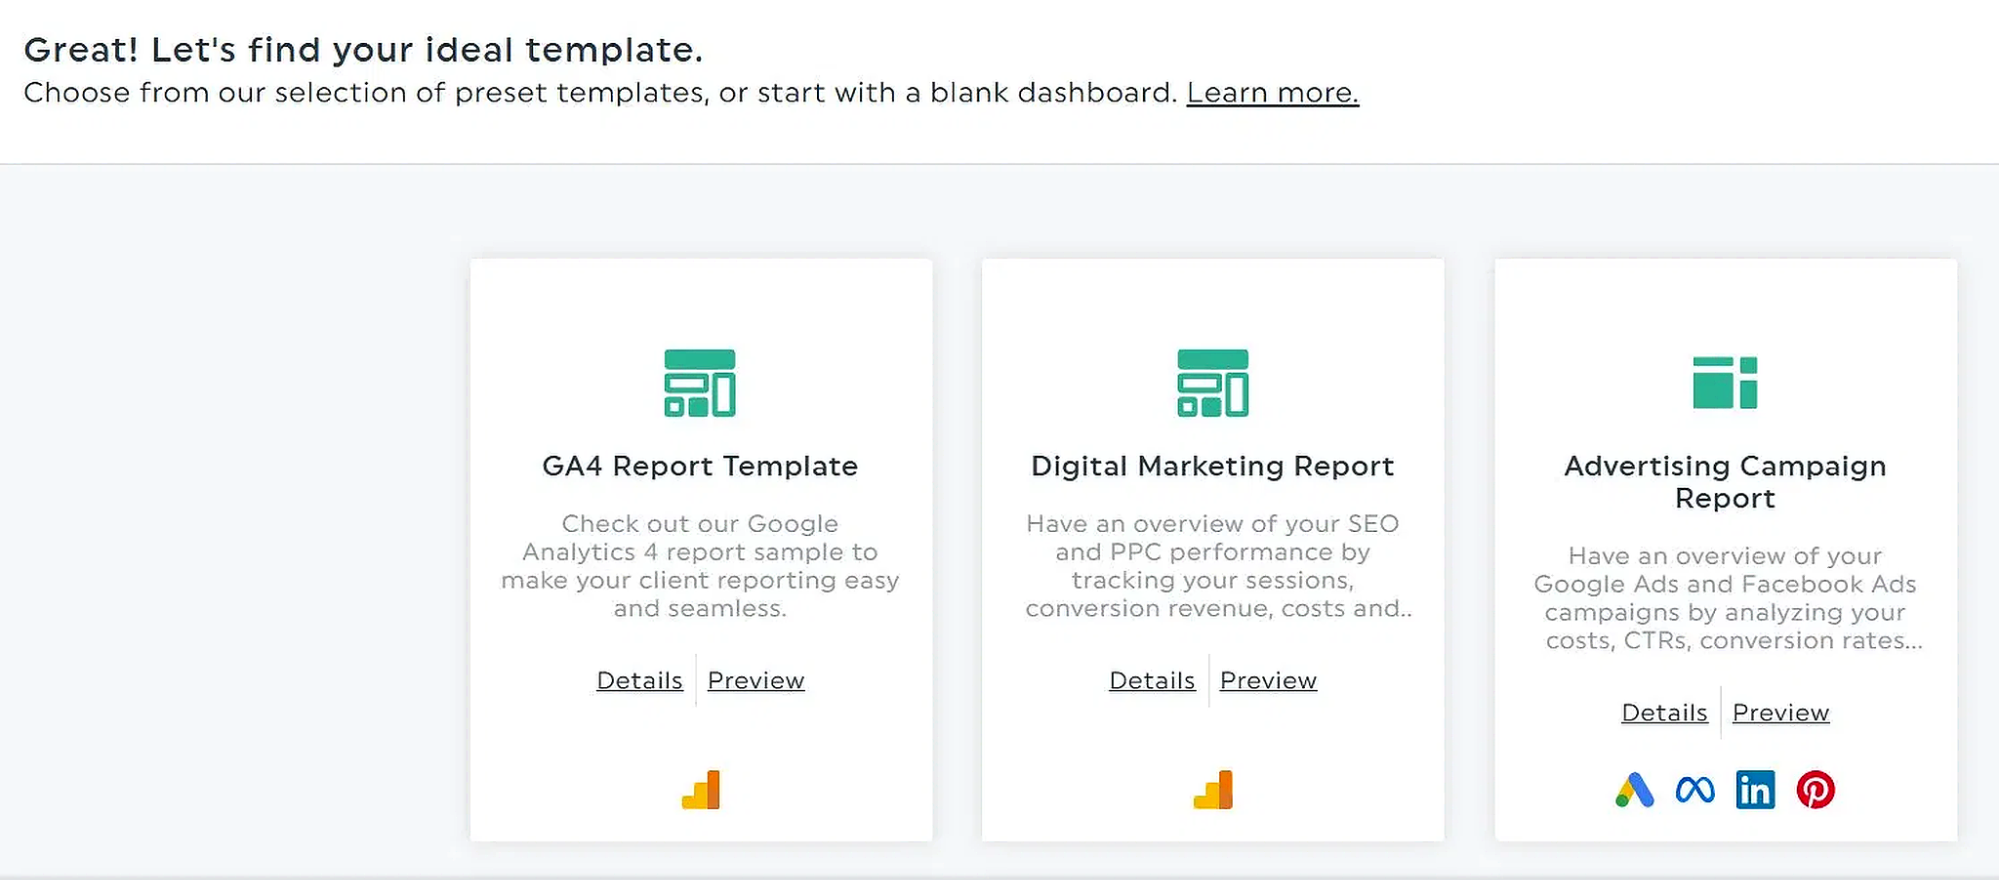
Once I opened the account, the template populated immediately, and I chose "Advertising campaign report" and connected it to my Facebook account.
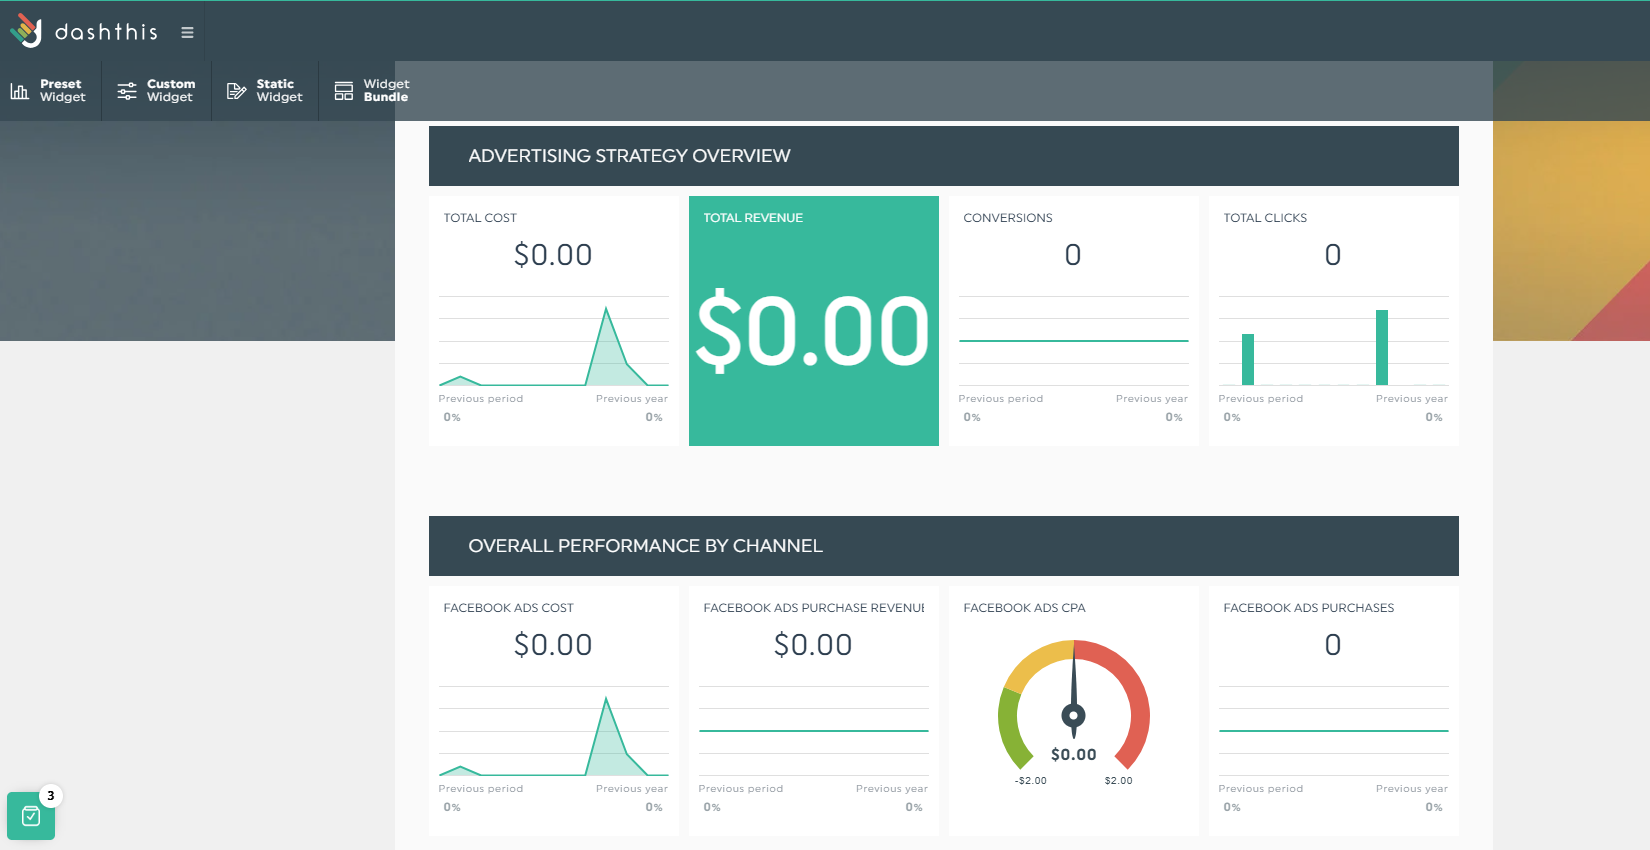
The dashboard itself is built from a widget system: Preset Widgets, Custom Widgets, Static Widgets, and Widget Bundles, so you can add, remove, or rearrange blocks without touching any code.
Before wrapping up your report, you can also tap into their AI-powered insights feature, which breaks your performance down depending on what you need (like a summary of key metrics and trends, opportunities for actionable improvement, etc.)
And on the presentation side, you can apply a color theme to the dashboard from a set of pre-built palettes, or bring in your own to match a client's brand.

Key features
- Pre-set report templates for social media, PPC, and email campaigns
- Drag-and-drop widget library
- Scheduled automated email delivery
- PDF and shareable link export
- Multi-channel reports in a single dashboard
Facebook-specific strengths
The Facebook Ads connection takes seconds. KPI widgets surface the metrics clients care about without requiring manual configuration.
Pricing
Starts at $54/month.
Free tier: 15-day free trial
Bottom line
If your clients want clean monthly reports and you want to spend 15 minutes producing them, this tool delivers.
6. Madgicx
Best for: Facebook advertisers who want reporting + optimization in one tool
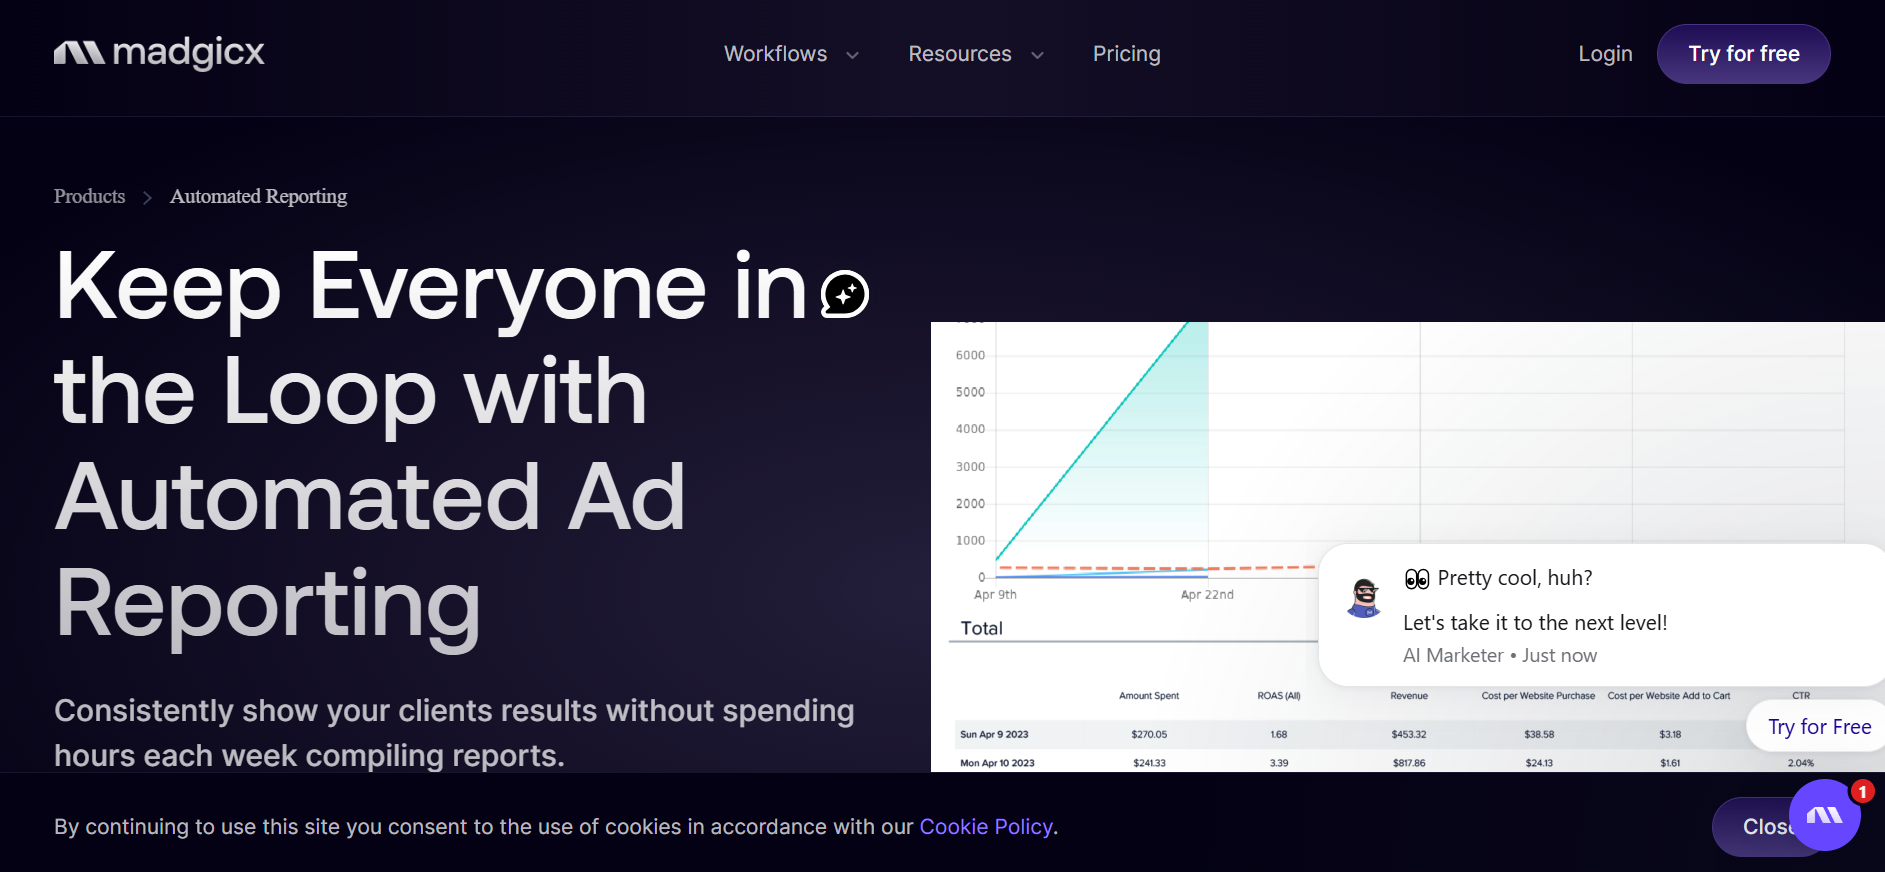
Madgicx is a Facebook-native analytics platform that combines reporting with AI-powered insights and automation.
Because it's built specifically for Meta advertising, the depth of Facebook-specific metrics is considerably higher than that of general-purpose tools.
The reporting side is built around two things: a Facebook Ads Dashboard that gives you a bird's-eye view of your entire ad account, and an Automated Reporting feature that handles scheduled delivery to clients or stakeholders.
You set the cadence, choose the metrics that matter, and Madgicx automatically updates the tables and graphs and sends the report at the exact time you specify.
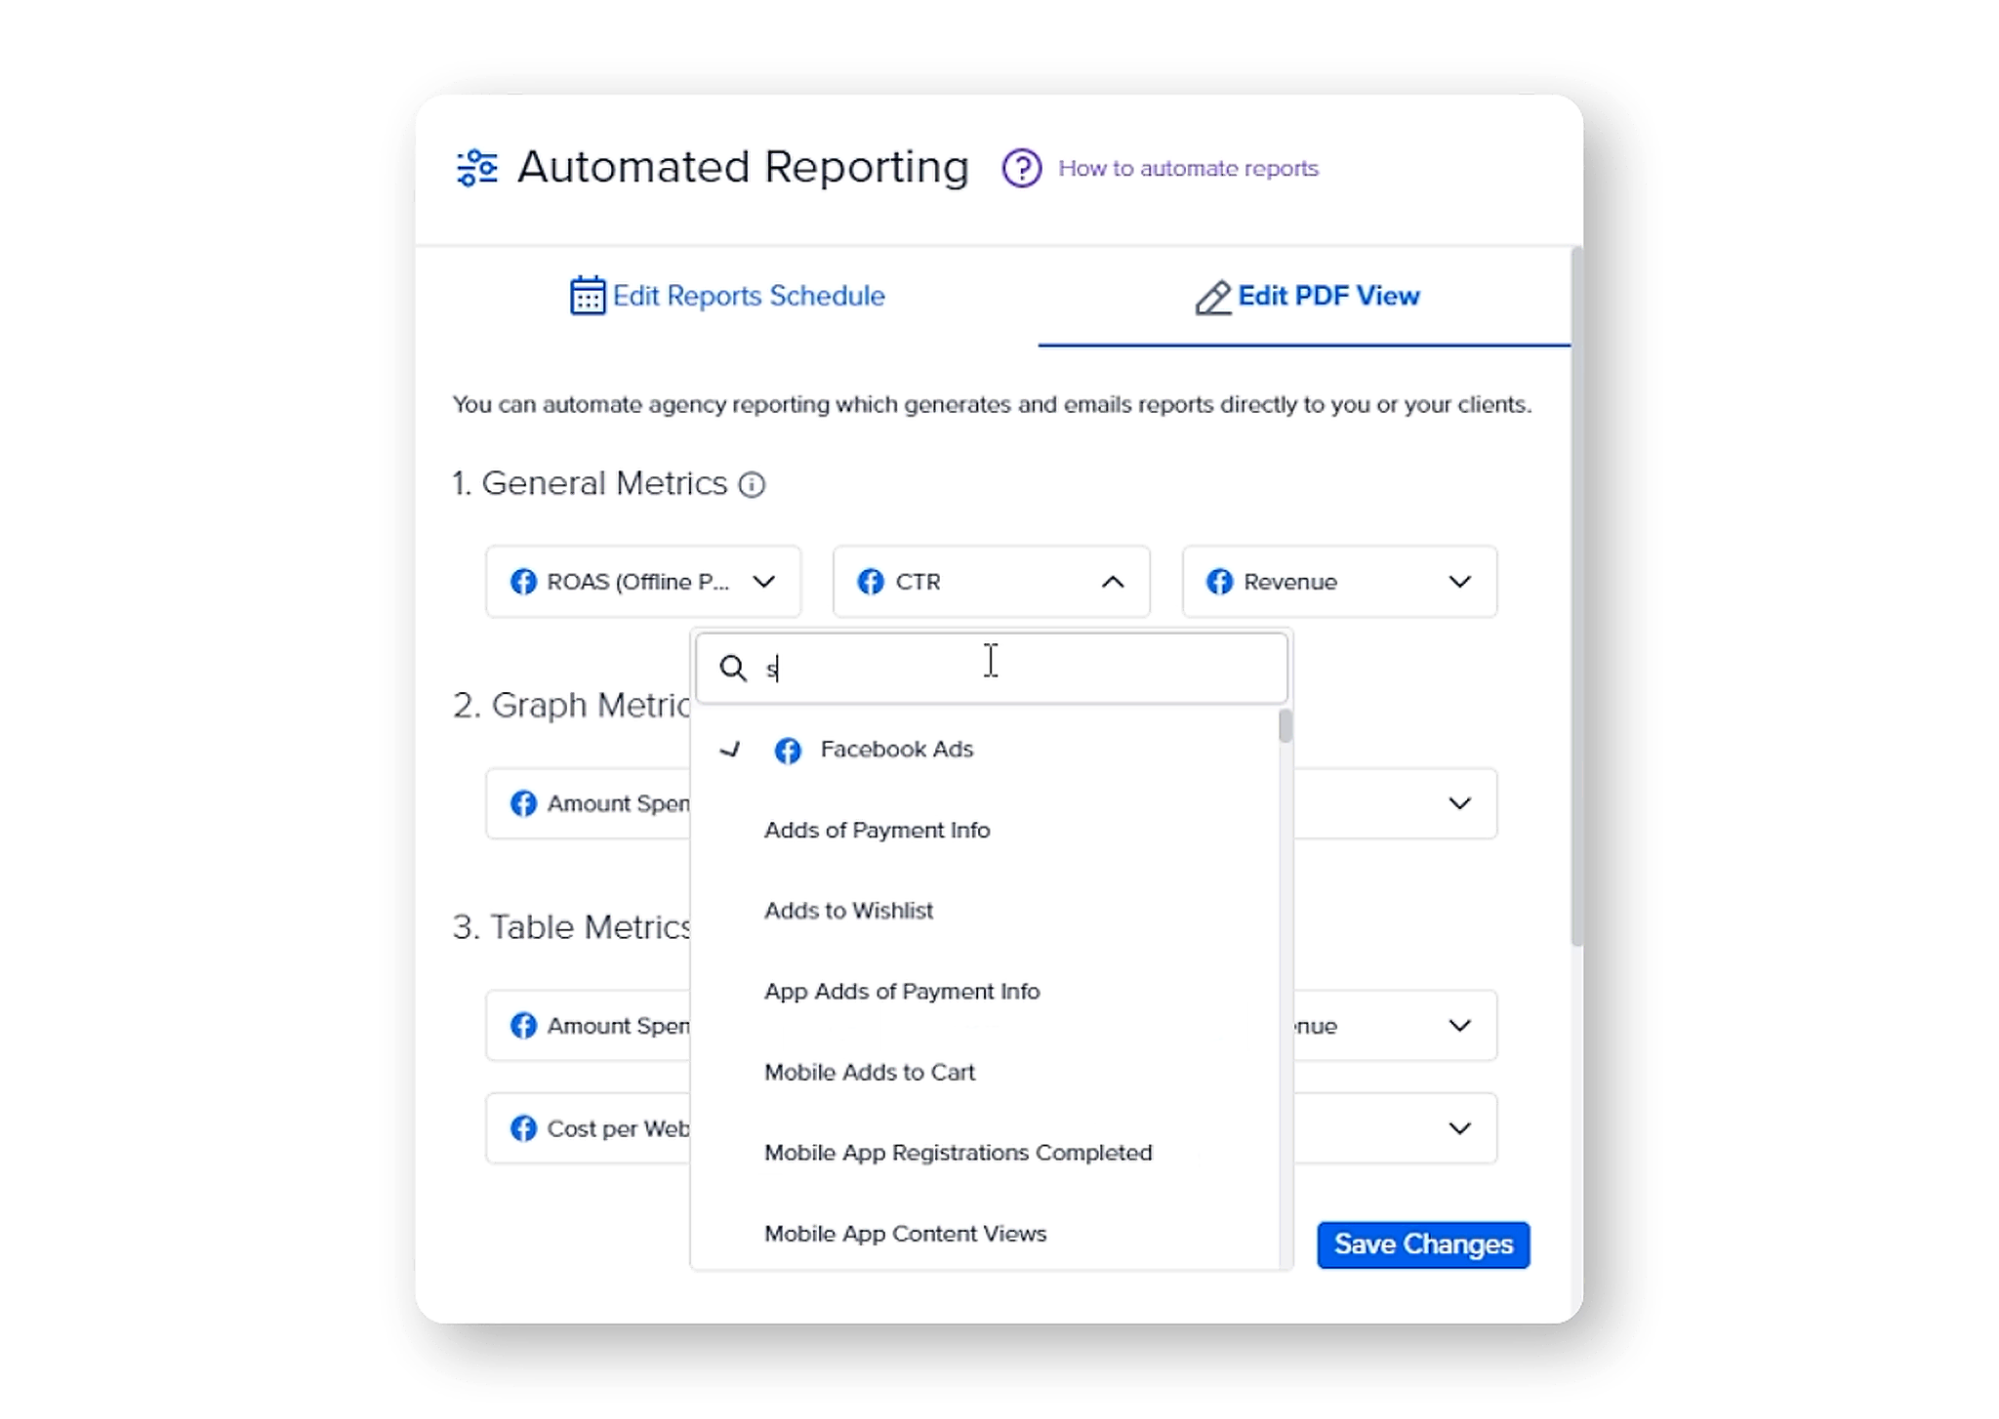
Image source: Madgicx
Note that starting a free trial with Madgicx requires entering card details.
Key features
- Creative analytics with funnel-stage performance breakdown
- Audience-segmentation insights
- Automated budget optimization
- AI-generated performance insights and recommendations
- Funnel-based reporting
Facebook-specific strengths
Purpose-built for Meta advertising. The creative intelligence features go deeper than Ads Manager's basic creative reporting.
Pricing
Starts at $45/month.
Free tier: 7-day free trial
Bottom line
The right tool for Facebook-focused advertisers who want analytical depth beyond dashboards.
7. Funnel.io
Best for: Data teams that need a unified data warehouse
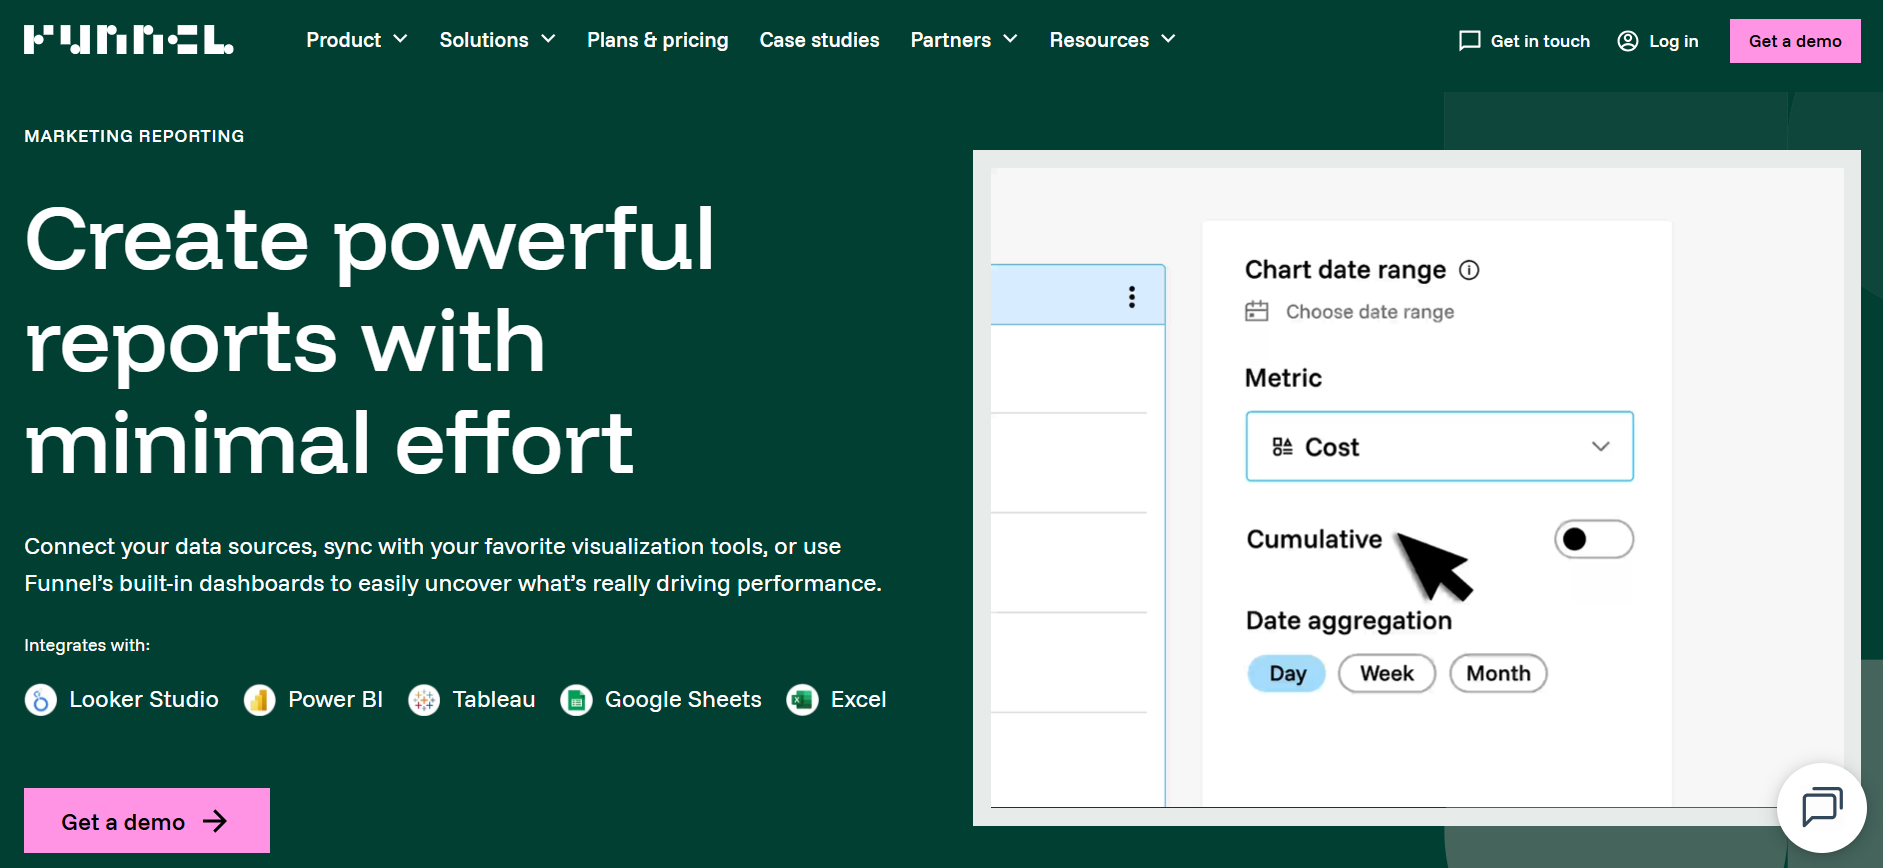
Funnel.io is an enterprise infrastructure that collects data from 500+ platforms and marketing sources, normalizes it into a unified schema, and pipes it to your data warehouse.
Unlike every other tool here, there's no free trial and no self-serve onboarding. Every CTA on the page leads to "Book a demo," which tells you something about who this is built for before you've even seen the product.
That said, what Funnel offers on paper is powerful. It's an official partner of Microsoft, Google, and Tableau, so the integrations are native rather than connector-dependent.
The reporting workflow follows a few steps: connect and prepare your data, create reports inside Funnel's dashboard builder or send them to your destination of choice, then act on the insights.
For agencies managing enterprise clients, Funnel also offers client-facing Portals (shared dashboards with controlled access) so clients can check in on performance without you sending a PDF every Monday.
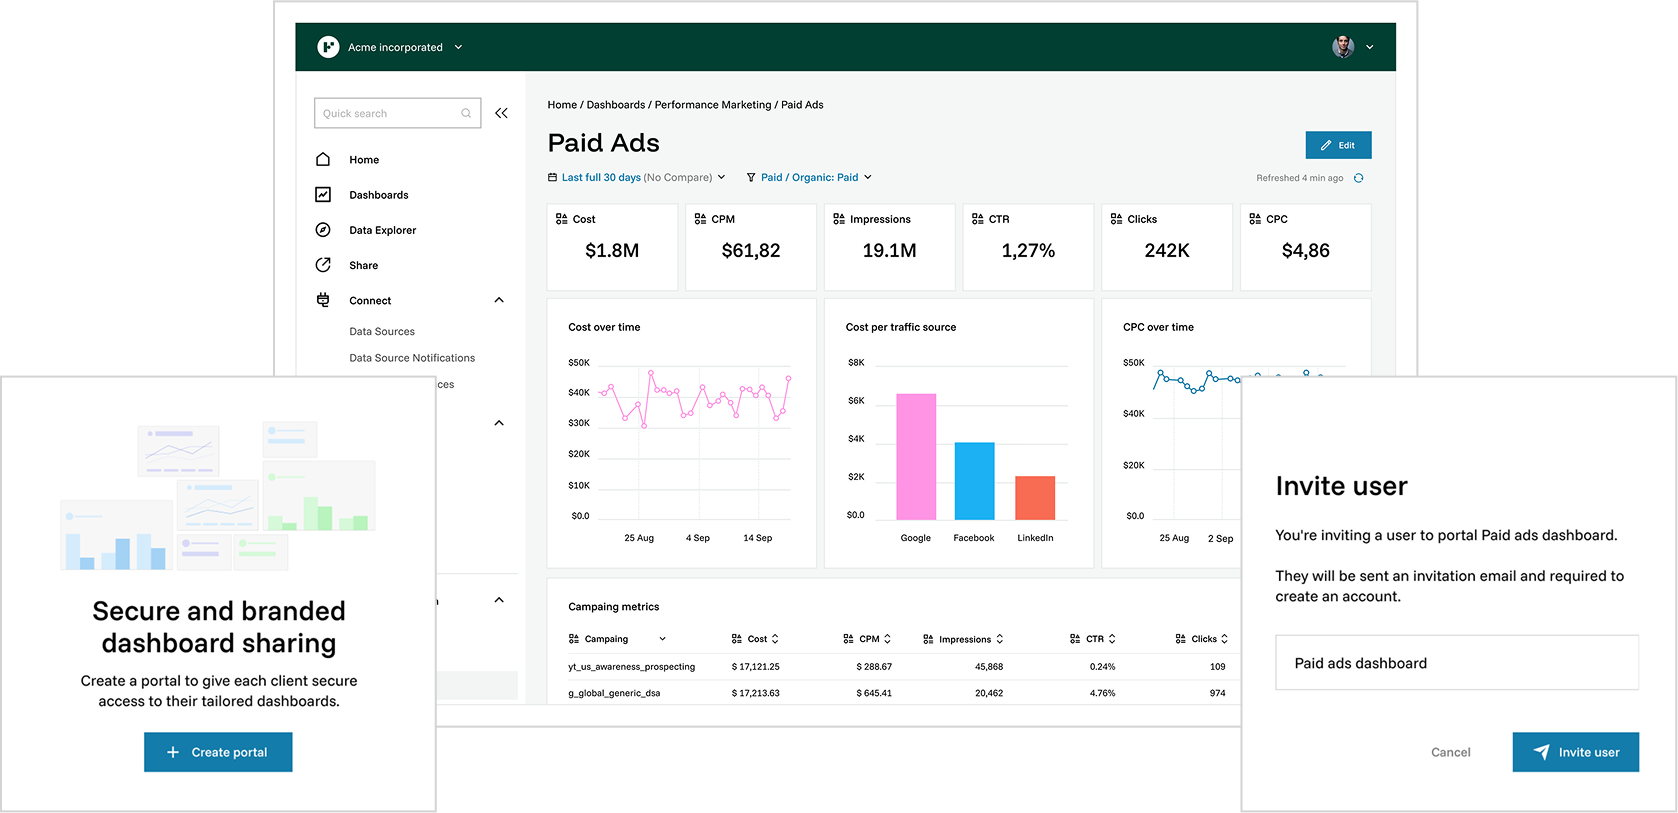
Image source: Funnel.io
Key features
- 500+ data source connectors
- Automatic data transformation and normalization
- Direct warehouse integrations
- Cross-platform metric mapping
- Automated data quality checks
Facebook-specific strengths
Funnel normalizes Facebook's notoriously messy attribution data alongside every other platform you run, giving you one consistent definition of "conversion," "ROAS," and "spend" across platforms like Meta, Google, TikTok, and LinkedIn.
Pricing
Custom pricing based on data volume and number of connectors.
Free tier: Option to get a demo
Bottom line
Overkill for most advertisers. Essential for teams doing serious cross-platform attribution analysis or feeding marketing data into a broader business intelligence stack.
8. Triple Whale
Best for: DTC e-commerce brands on Shopify
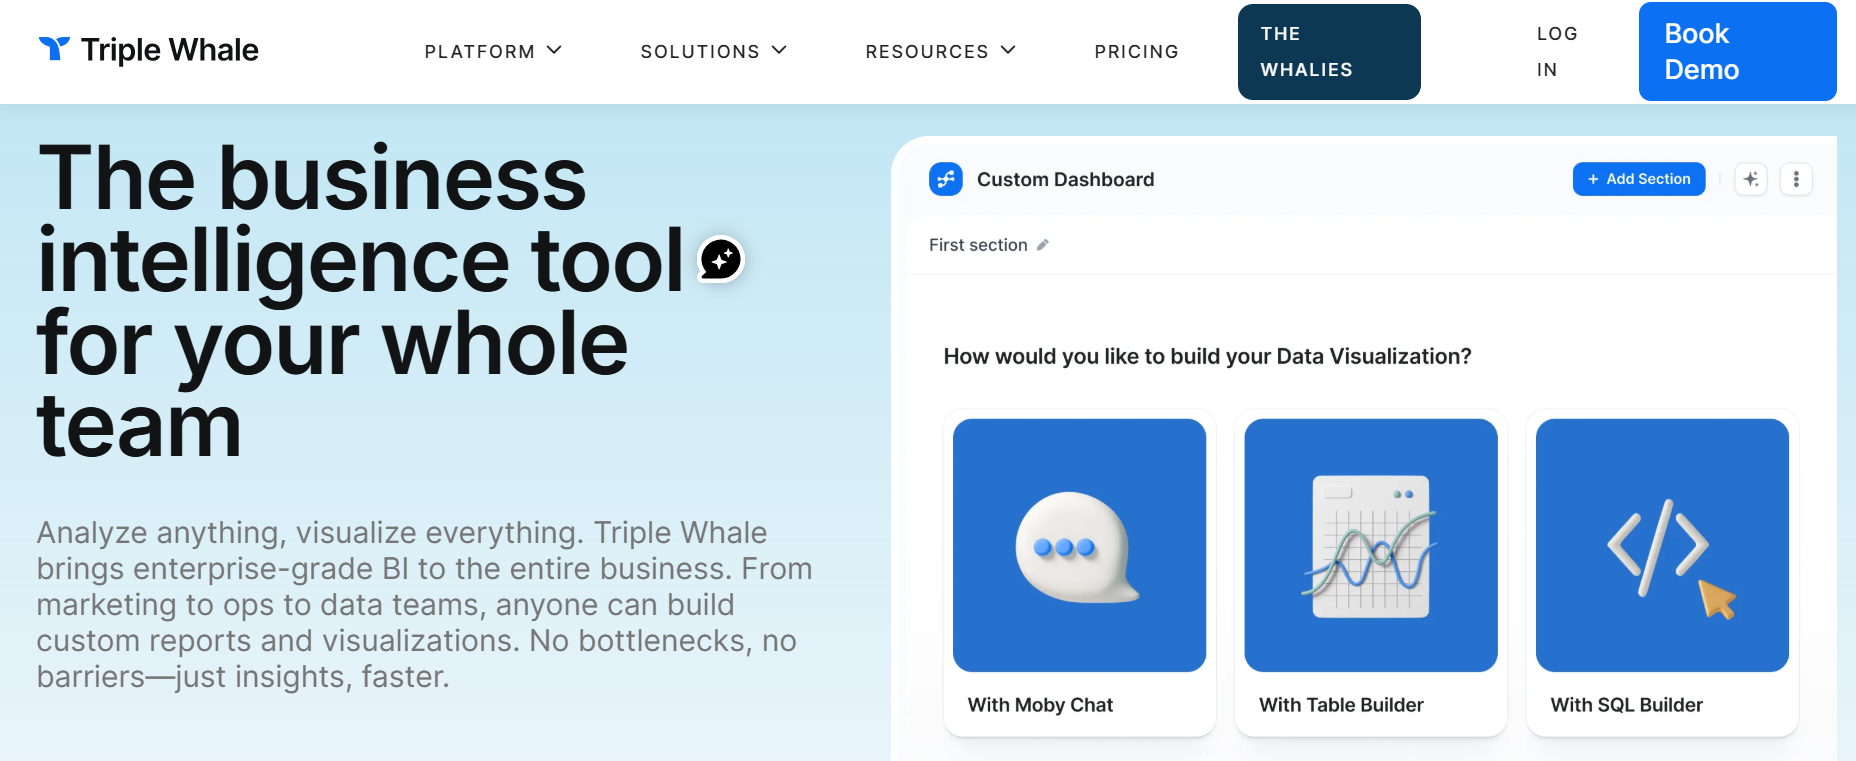
Triple Whale was built to connect your ad platforms, Shopify store, and first-party data to give you a unified view of actual revenue.
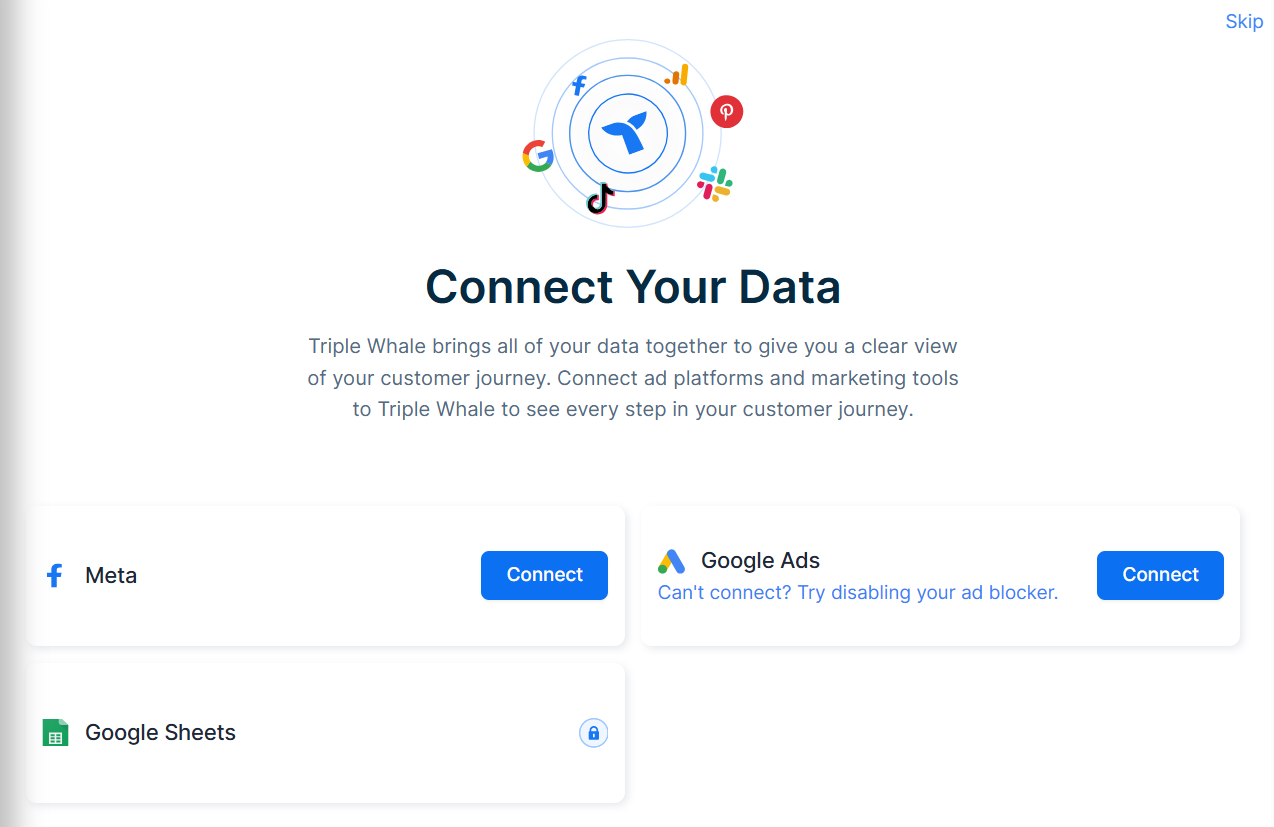
When you first open Triple Whale, the experience feels very onboarding-focused and beginner-friendly compared to more technical BI platforms.
The platform walks you through a setup flow where you connect your ecommerce and marketing data sources first. Once connected, Triple Whale automatically pulls your marketing and store data into a centralized dashboard.
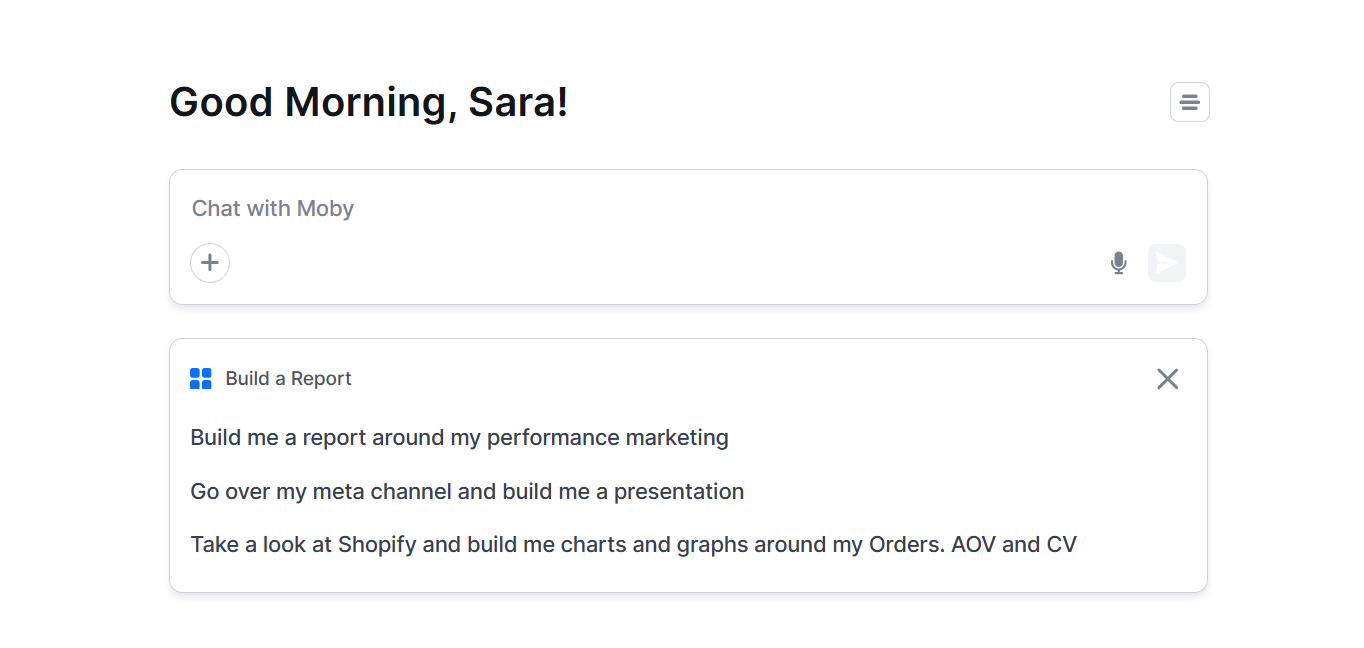
The platform also pushes its AI assistant, "Moby," quite heavily throughout the interface. In testing, the homepage feels more like an AI-powered analytics workspace than a traditional reporting tool.
Key features
- Server-side tracking via Triple Pixel
- Multi-touch attribution across Facebook, Google, TikTok, and email
- Real-time profit dashboard
- Creative analytics with true ROAS at the creative level
- Cohort analysis and LTV reporting
Facebook-specific strengths
Resolves the gap between Facebook's reported conversions and your actual Shopify orders. For DTC brands, the clarity it provides changes bidding decisions, creative allocation, and budget distribution.
Pricing
Starts at $129/month.
Free tier: 7-day free trial
Bottom line
Non-negotiable for ecommerce brands spending $20k+/month on Facebook who need to know what's actually working.
9. Whatagraph
Best for: Visual, design-forward reports
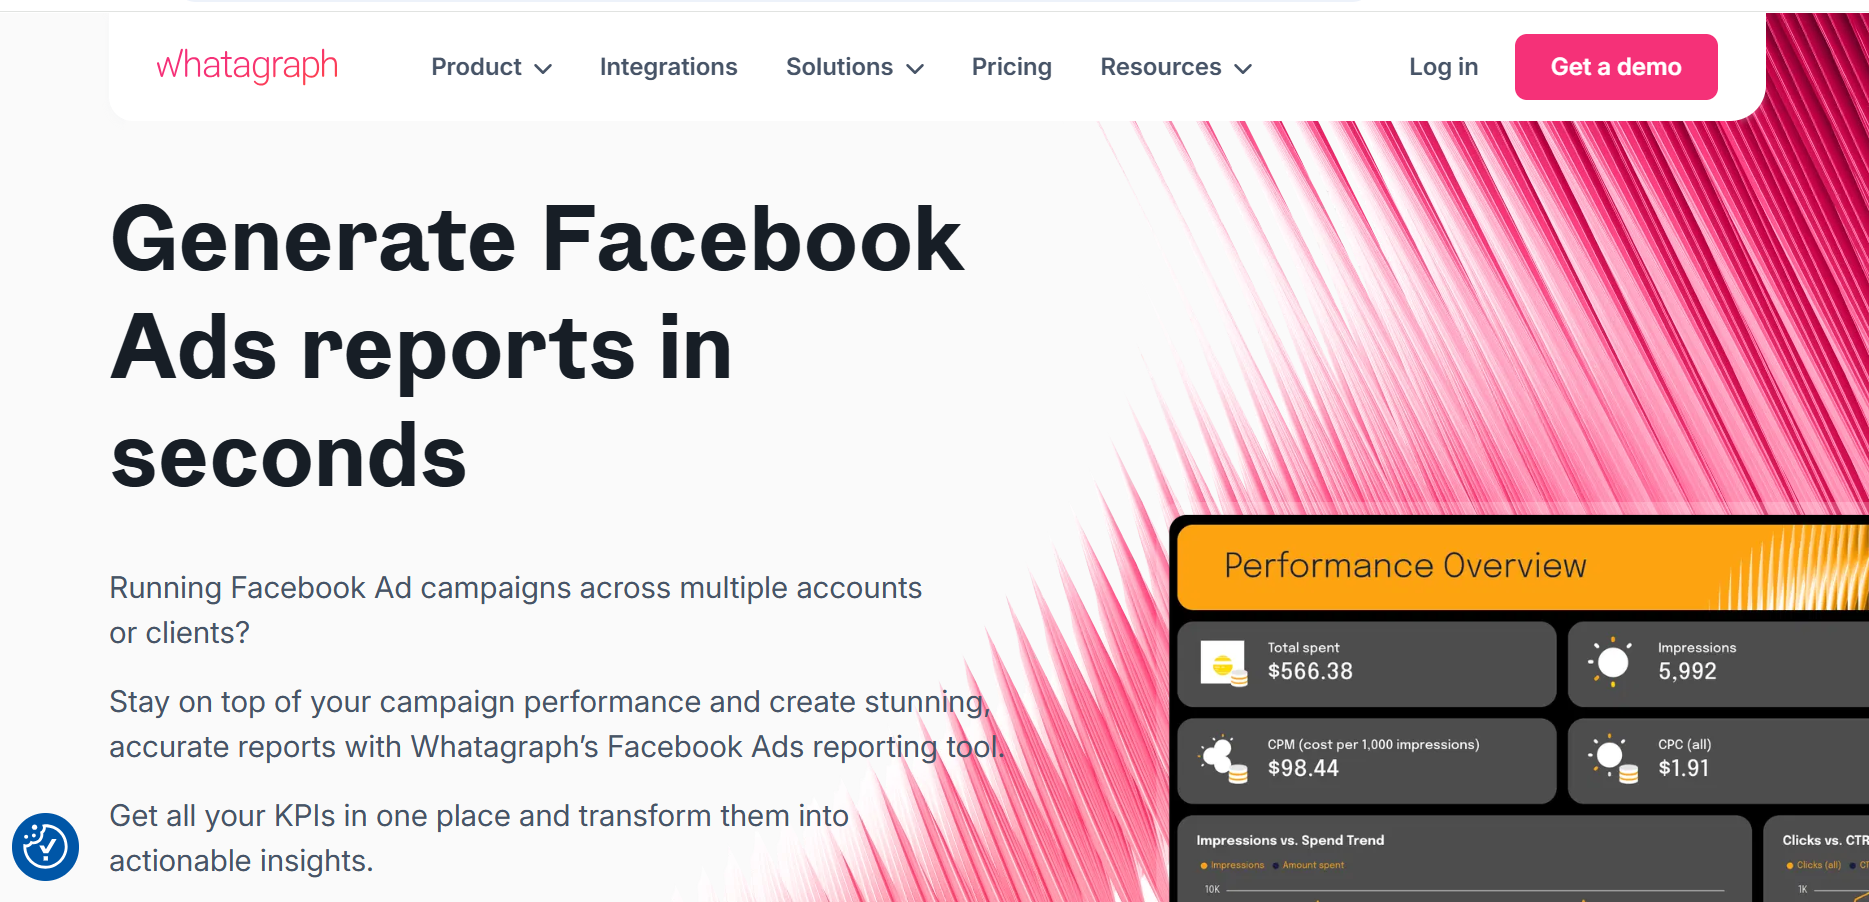
Whatagraph occupies a specific niche: reporting that looks good enough to present in a client meeting.
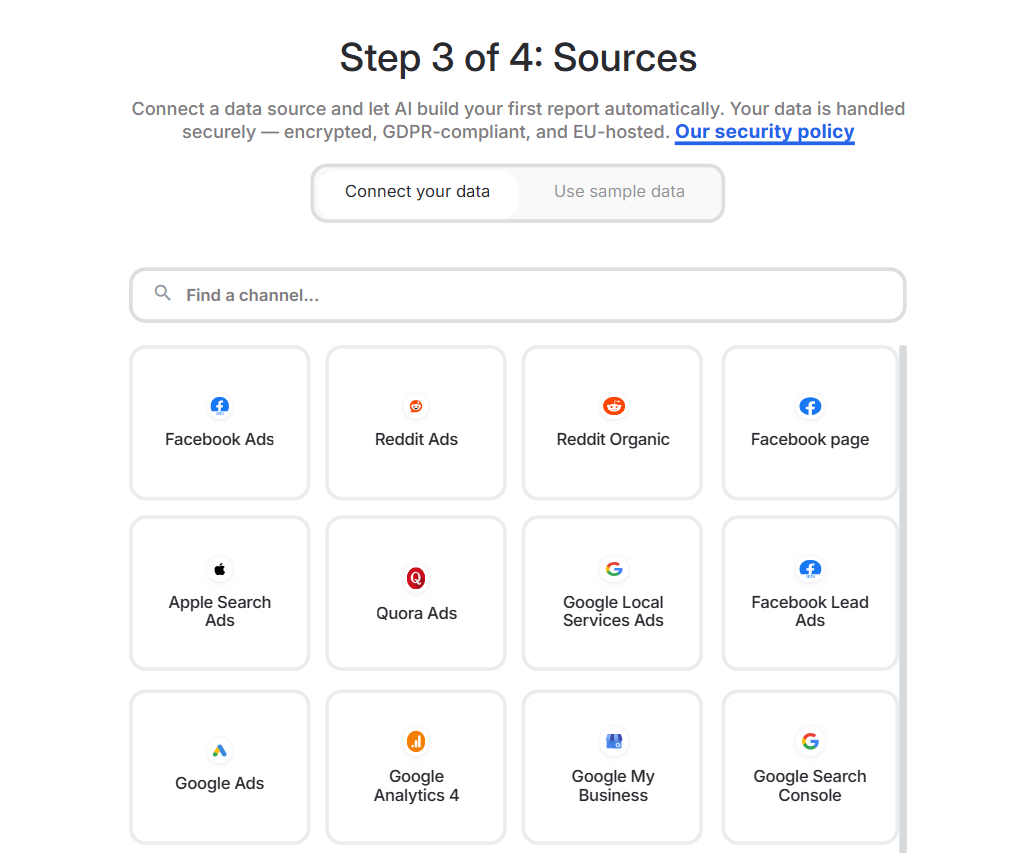
Once connected, Whatagraph's AI report builder takes over. This is where you can simply describe what you want to see in plain language.
For example, I typed: "Show me Facebook Ads performance for the last 30 days, including spend, ROAS, CPA, CTR, impressions, and a campaign-level breakdown."
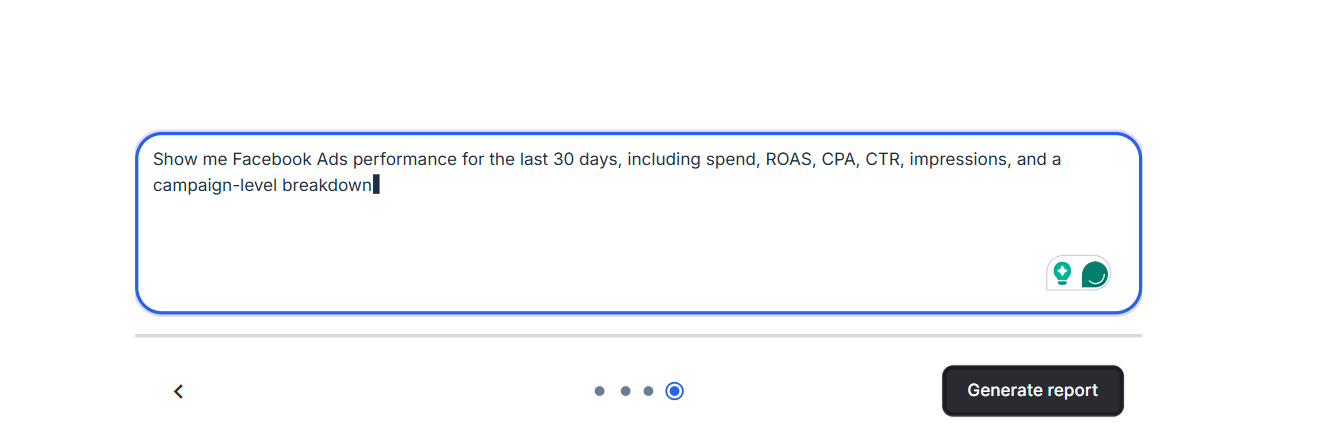
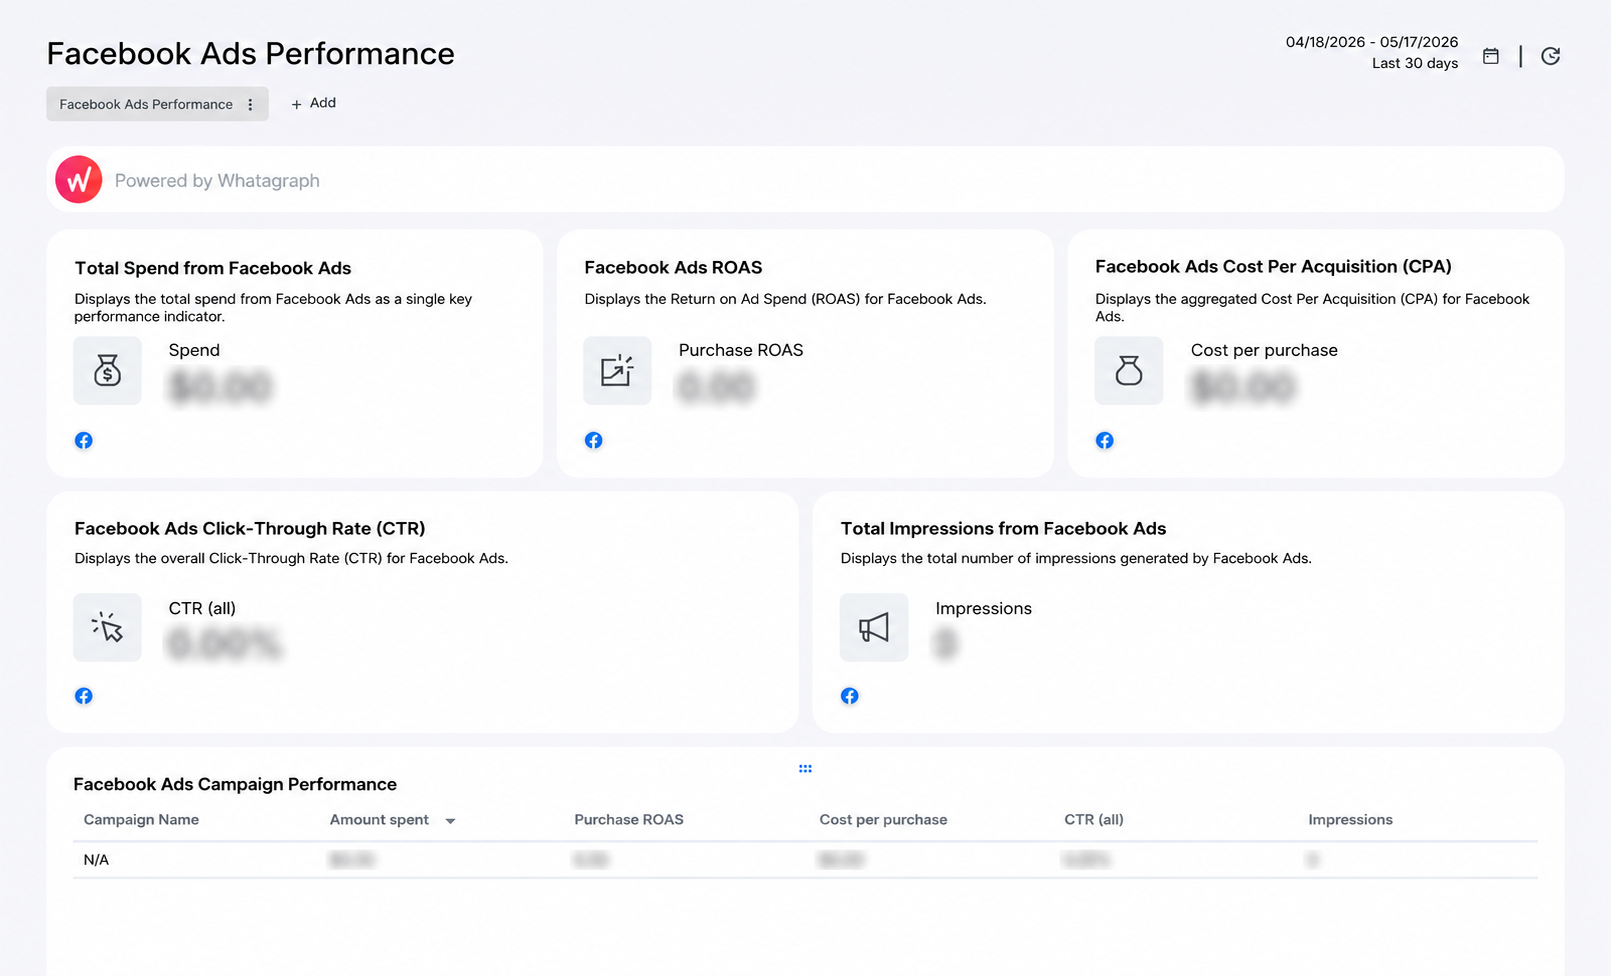
After pressing Generate within seconds, Whatagraph produced exactly what I asked for.
A clean Facebook Ads Performance report covering all insights as individual metric blocks at the top, followed by a Campaign Performance table breaking down every campaign by spend, ROAS, CPA, CTR, and impressions.
Key features
- Visually designed drag-and-drop builder
- Cross-channel report templates
- PDF export and live shareable links
- Custom branding options
Facebook-specific strengths
Native Facebook + Instagram combined reporting is a standout feature. Engagement metrics, reach, impressions, and paid performance in one cohesive view.
Pricing
Starts at €249/month ($289).
Free tier: The Free plan gives you basic reporting with limited credits.
Bottom line
Worth the premium for agencies where design quality matters.
10. Databox
Best for: Real-time KPI dashboards and goal tracking
Image source: G2
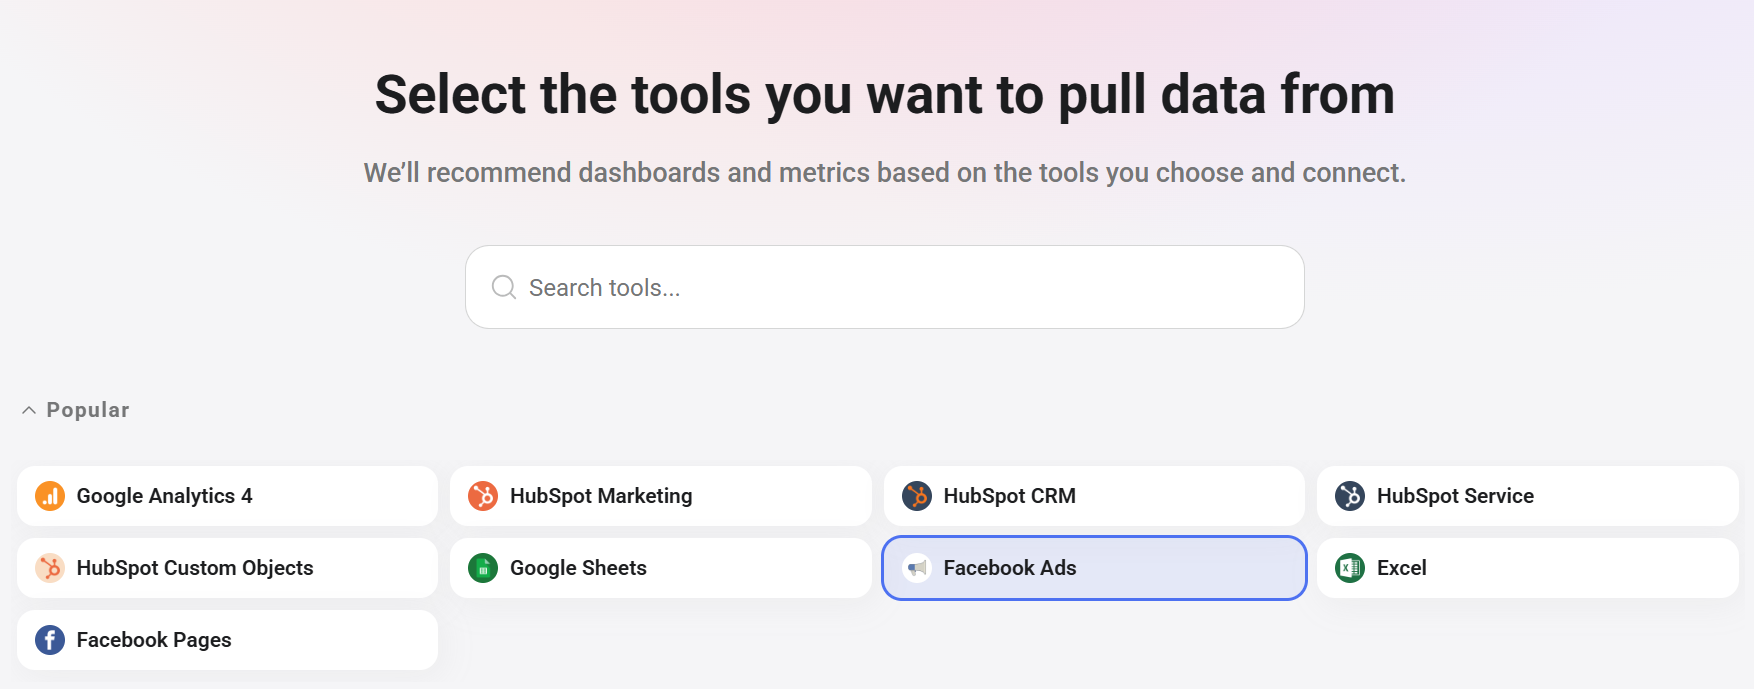
Similarly, to get started with Databox reporting, you'll first have the opportunity to connect whichever tools you want to pull data from.
The list is broad, and it includes Google Analytics, HubSpot, Google Sheets, Excel, Facebook Pages, and, of course, Facebook Ads.
Once connected, Databox automatically generates a dashboard from the data it pulls from your Facebook campaigns. In this case, it produced a ready-to-use Facebook Ads Performance Overview dashboard straight out of the box.
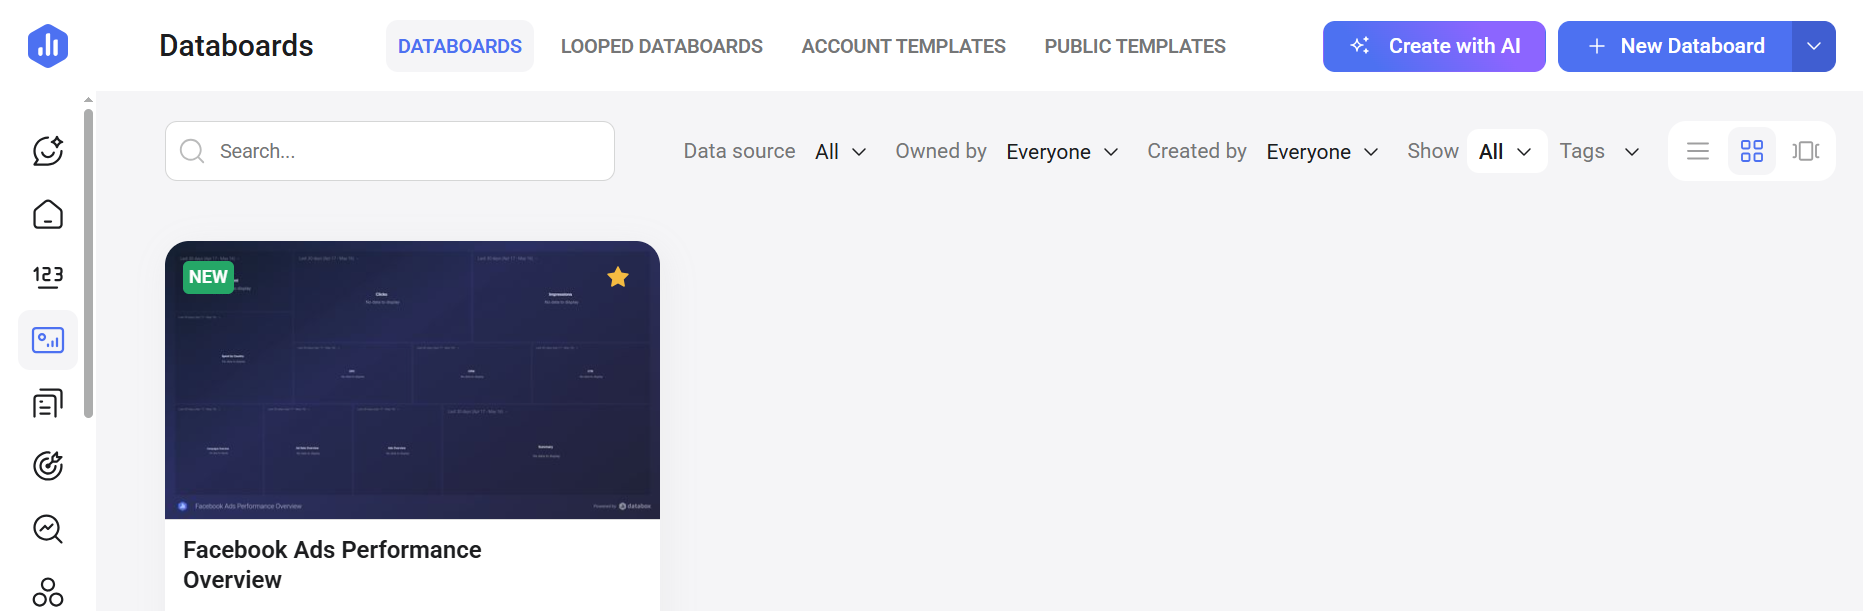
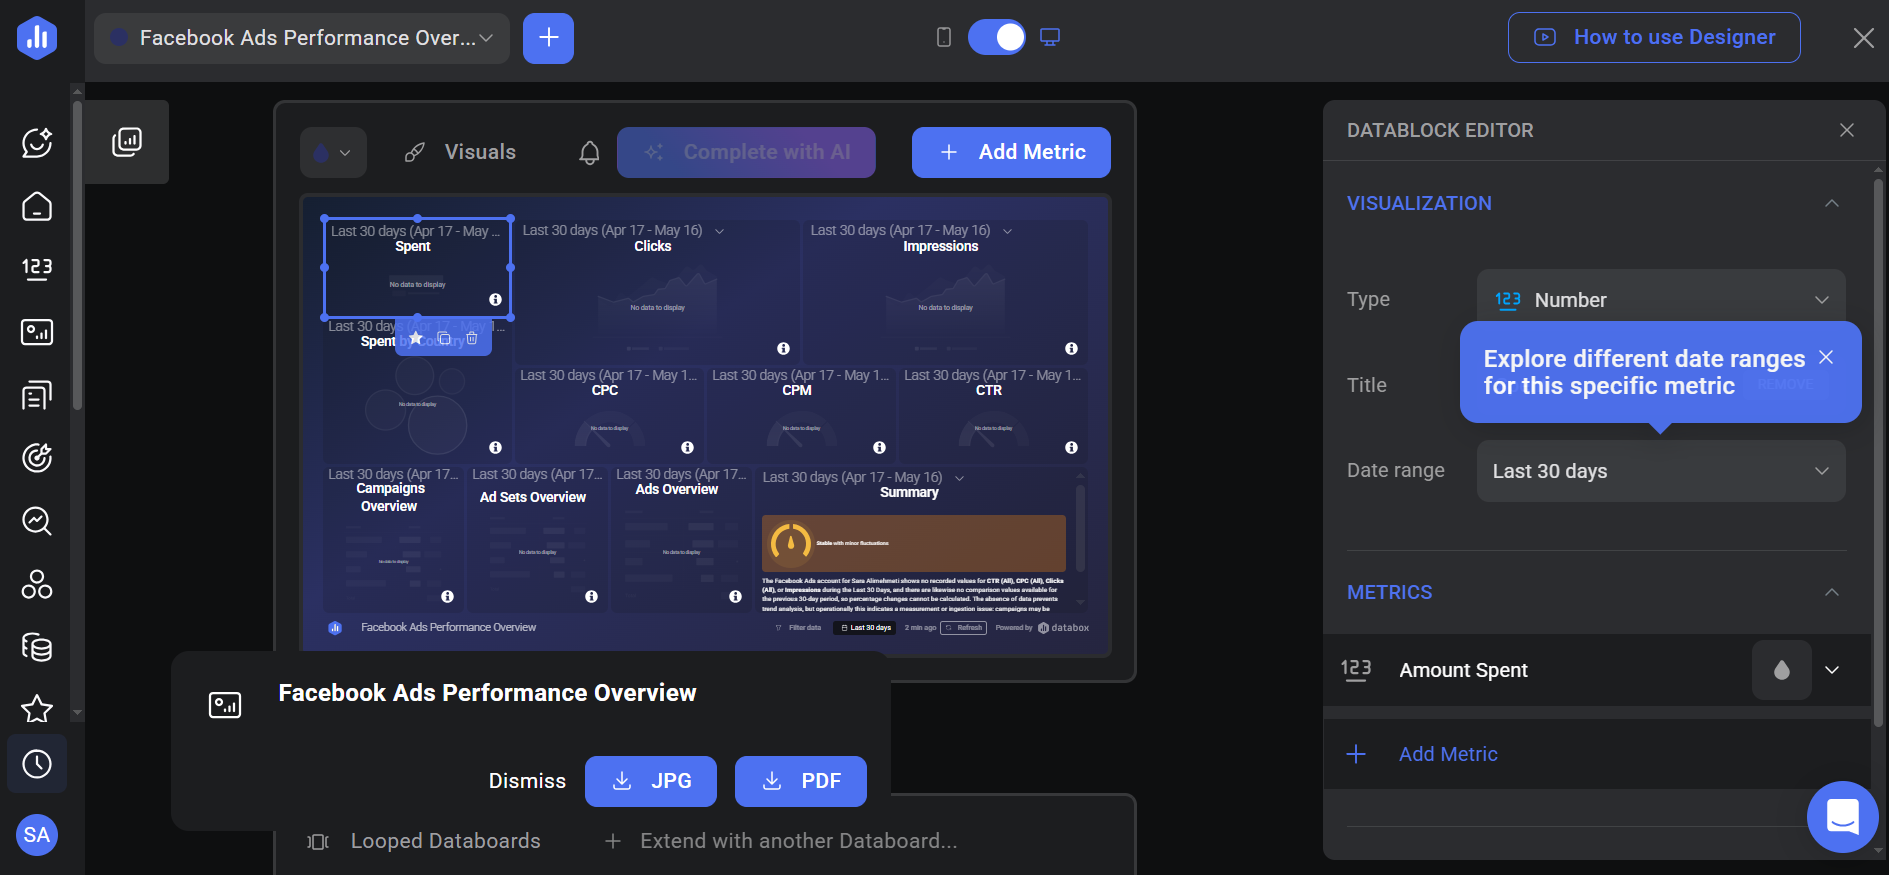
From there, the dashboard is fully editable. You can click into any metric block, change the visualization type, adjust the date range per metric, and add or swap metrics as needed, all from a clean sidebar editor.
Once you're happy with it, you can export it directly as a JPG or PDF with one click.
Key features
- Pre-built templates for Facebook Ads, Google Ads, Shopify, and more
- Mobile app with push notifications
- Goal-tracking against custom benchmarks
- Automated alerts when metrics deviate from expected ranges
- Multi-source blending in a single dashboard view
Facebook-specific strengths
Quick to set up and useful for daily performance checks.
Pricing
Paid plans start from $159/month (billed annually).
Free tier: 14-day trial
Bottom line
Databox's reporting is simple and aesthetic. After only a few steps, your Facebook Ads report is automatically generated, and from there, you can edit any metric block and export it as a JPG or PDF with one click.
Quick Comparison Table
Here's a quick glimpse into the 10 tools covered in this article, and key characteristics of each:
How to Choose the Right Facebook Ads Reporting Tool
The best reporting tool depends entirely on your role, workflow, and who you're reporting to.
- Solo media buyer or small in-house team: Start with Google Data Studio and a free Facebook connector. When manual reporting takes more than an hour per week, upgrade to Databox or DashThis.
- Facebook-focused advertiser running active creative tests: Madgicx, for analytical depth on creative and funnel-stage performance.
- Advertisers who want raw data in their own tools: Supermetrics, for pulling Facebook Ads data directly into Google Sheets, Google Data Studio, or any BI tool you already use.
- Teams that need live KPI monitoring and alerts: Databox, for real-time dashboards, goal tracking, and performance alerts across Facebook and 70+ other sources.
- Agency managing multiple clients: AgencyAnalytics, Whatagraph, or DashThis.
- E-commerce brands: Triple Whale.
- Data team with BI infrastructure: Funnel.io (then Google Data Studio or the analysis layer).
- High-volume media buyer: TheOptimizer for an all-in-one dashboard, including campaign automation + reporting.
Free Facebook Ads Report Templates
If you'd like to test reporting templates yourself, here are 3 free options you can start trying right away:
Template 1: Supermetrics Facebook Ads Report Template for Google Sheets
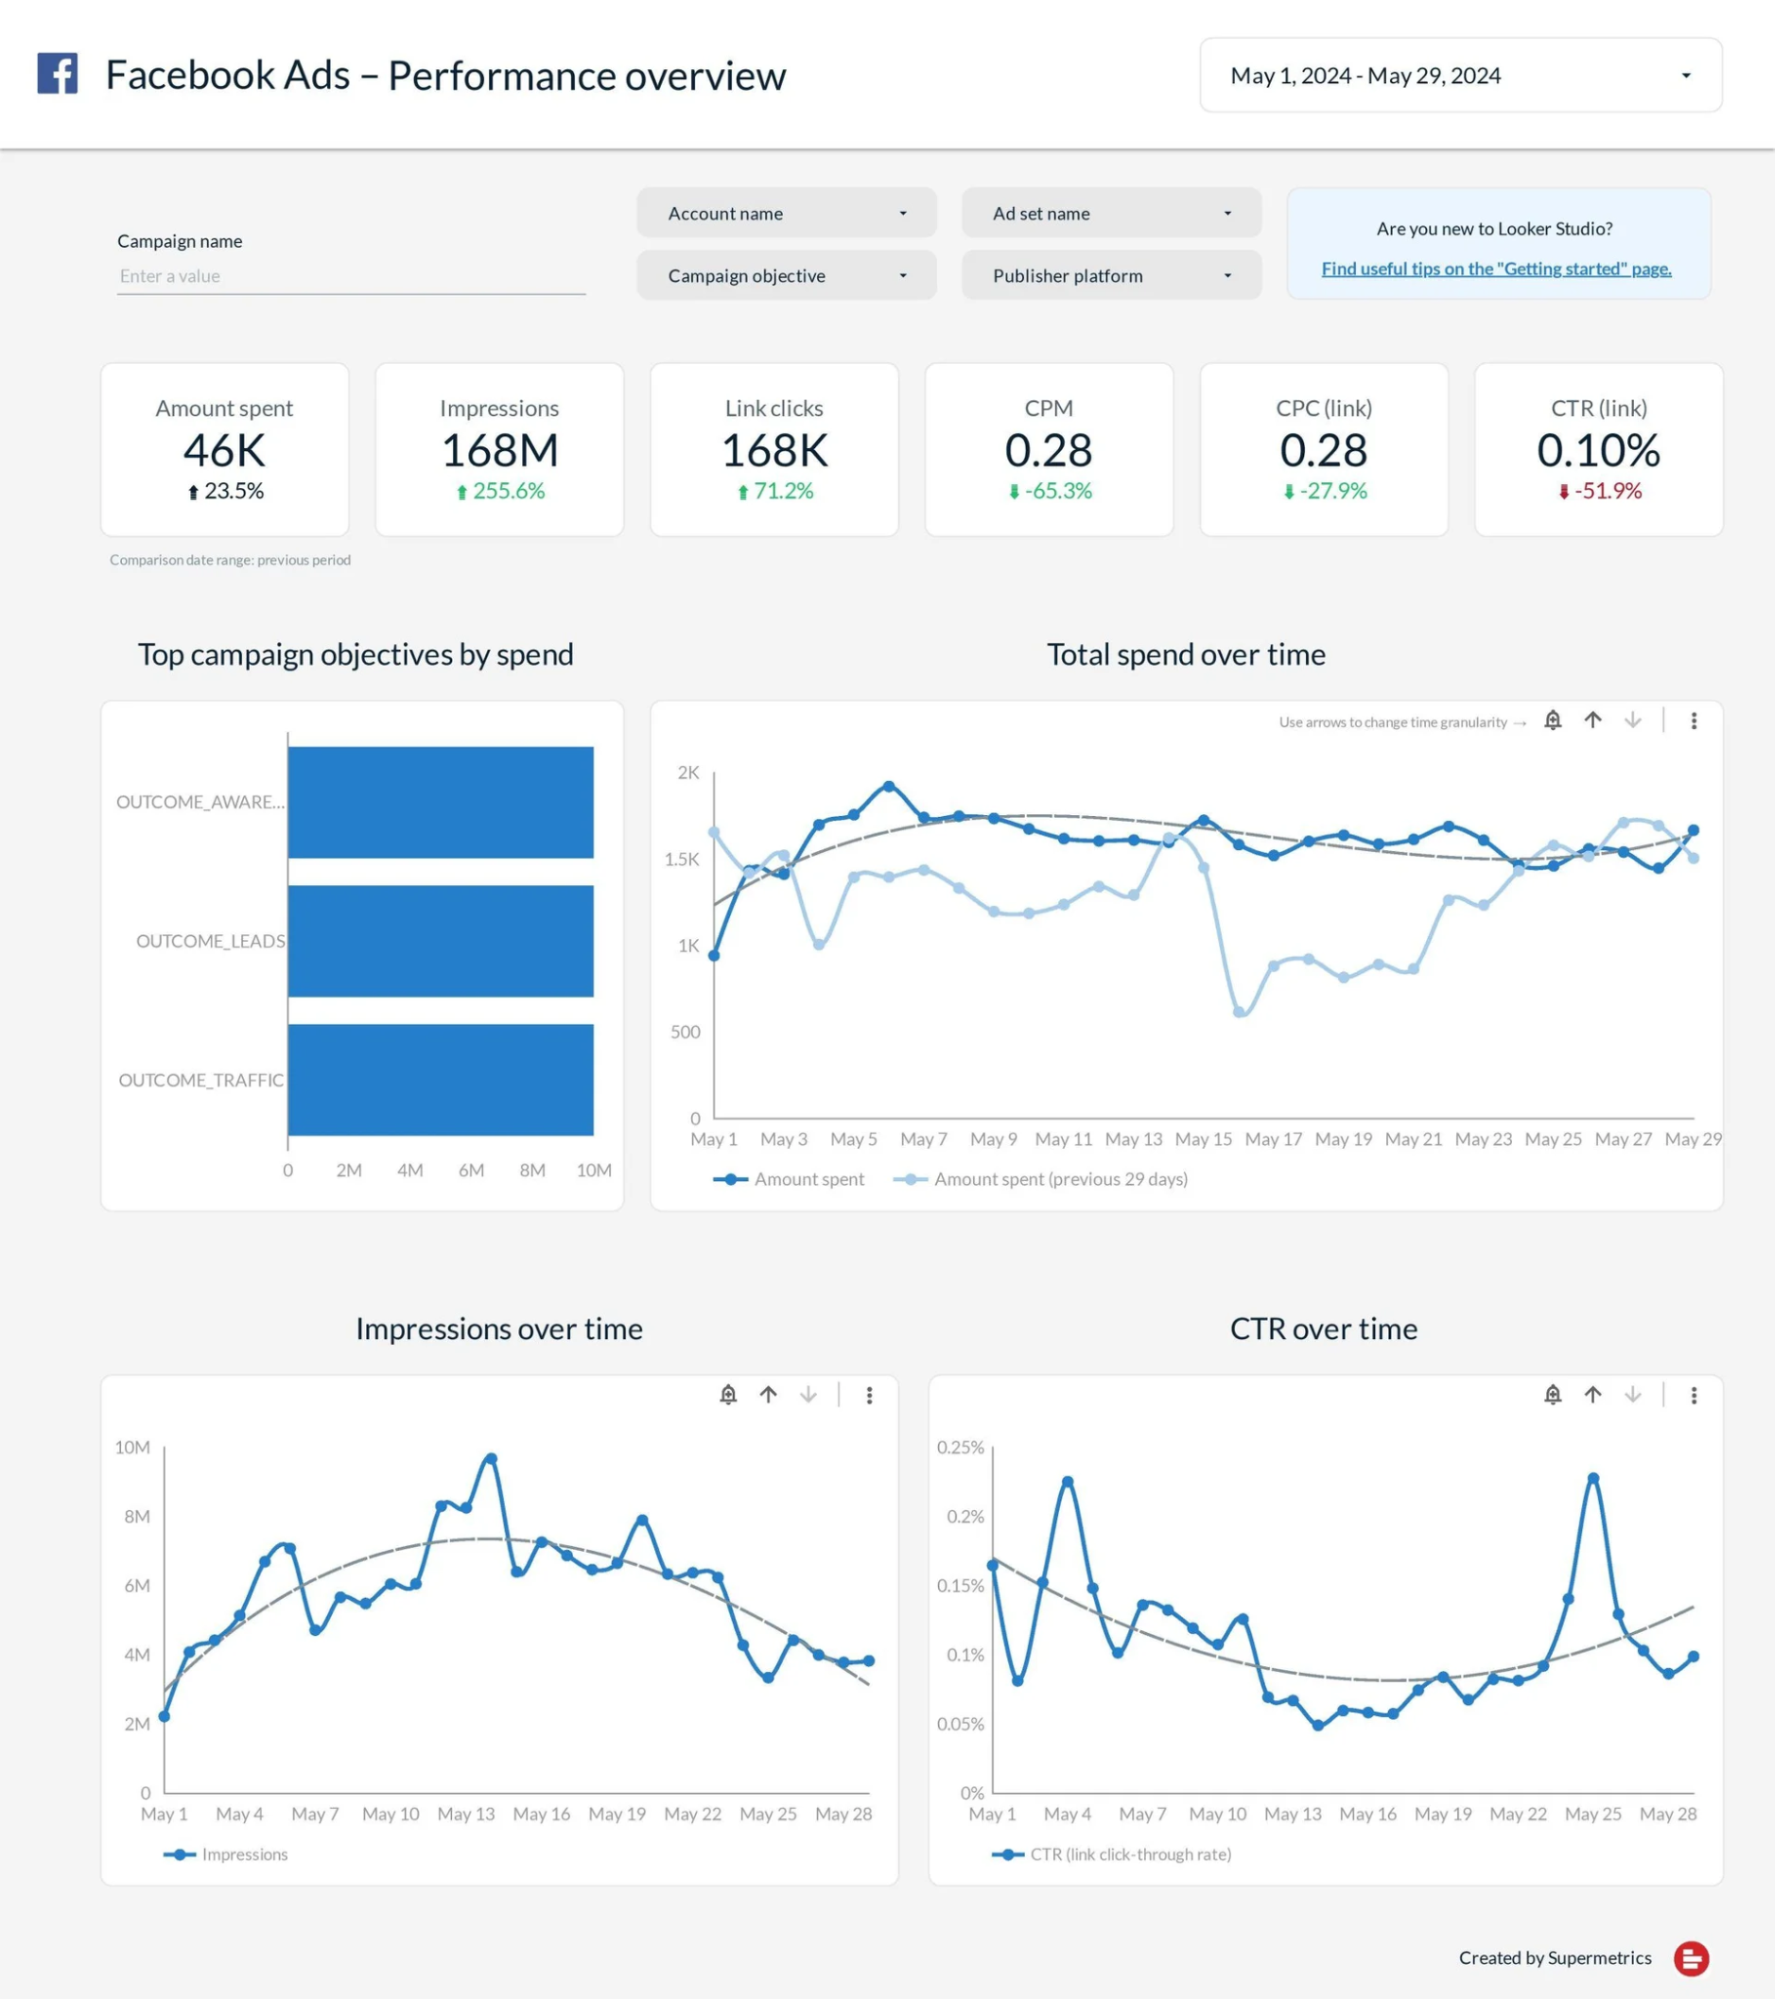
Get it here: Free Supermetrics Facebook Ads template
Template 2: Free Facebook Ads Report Template for Agencies
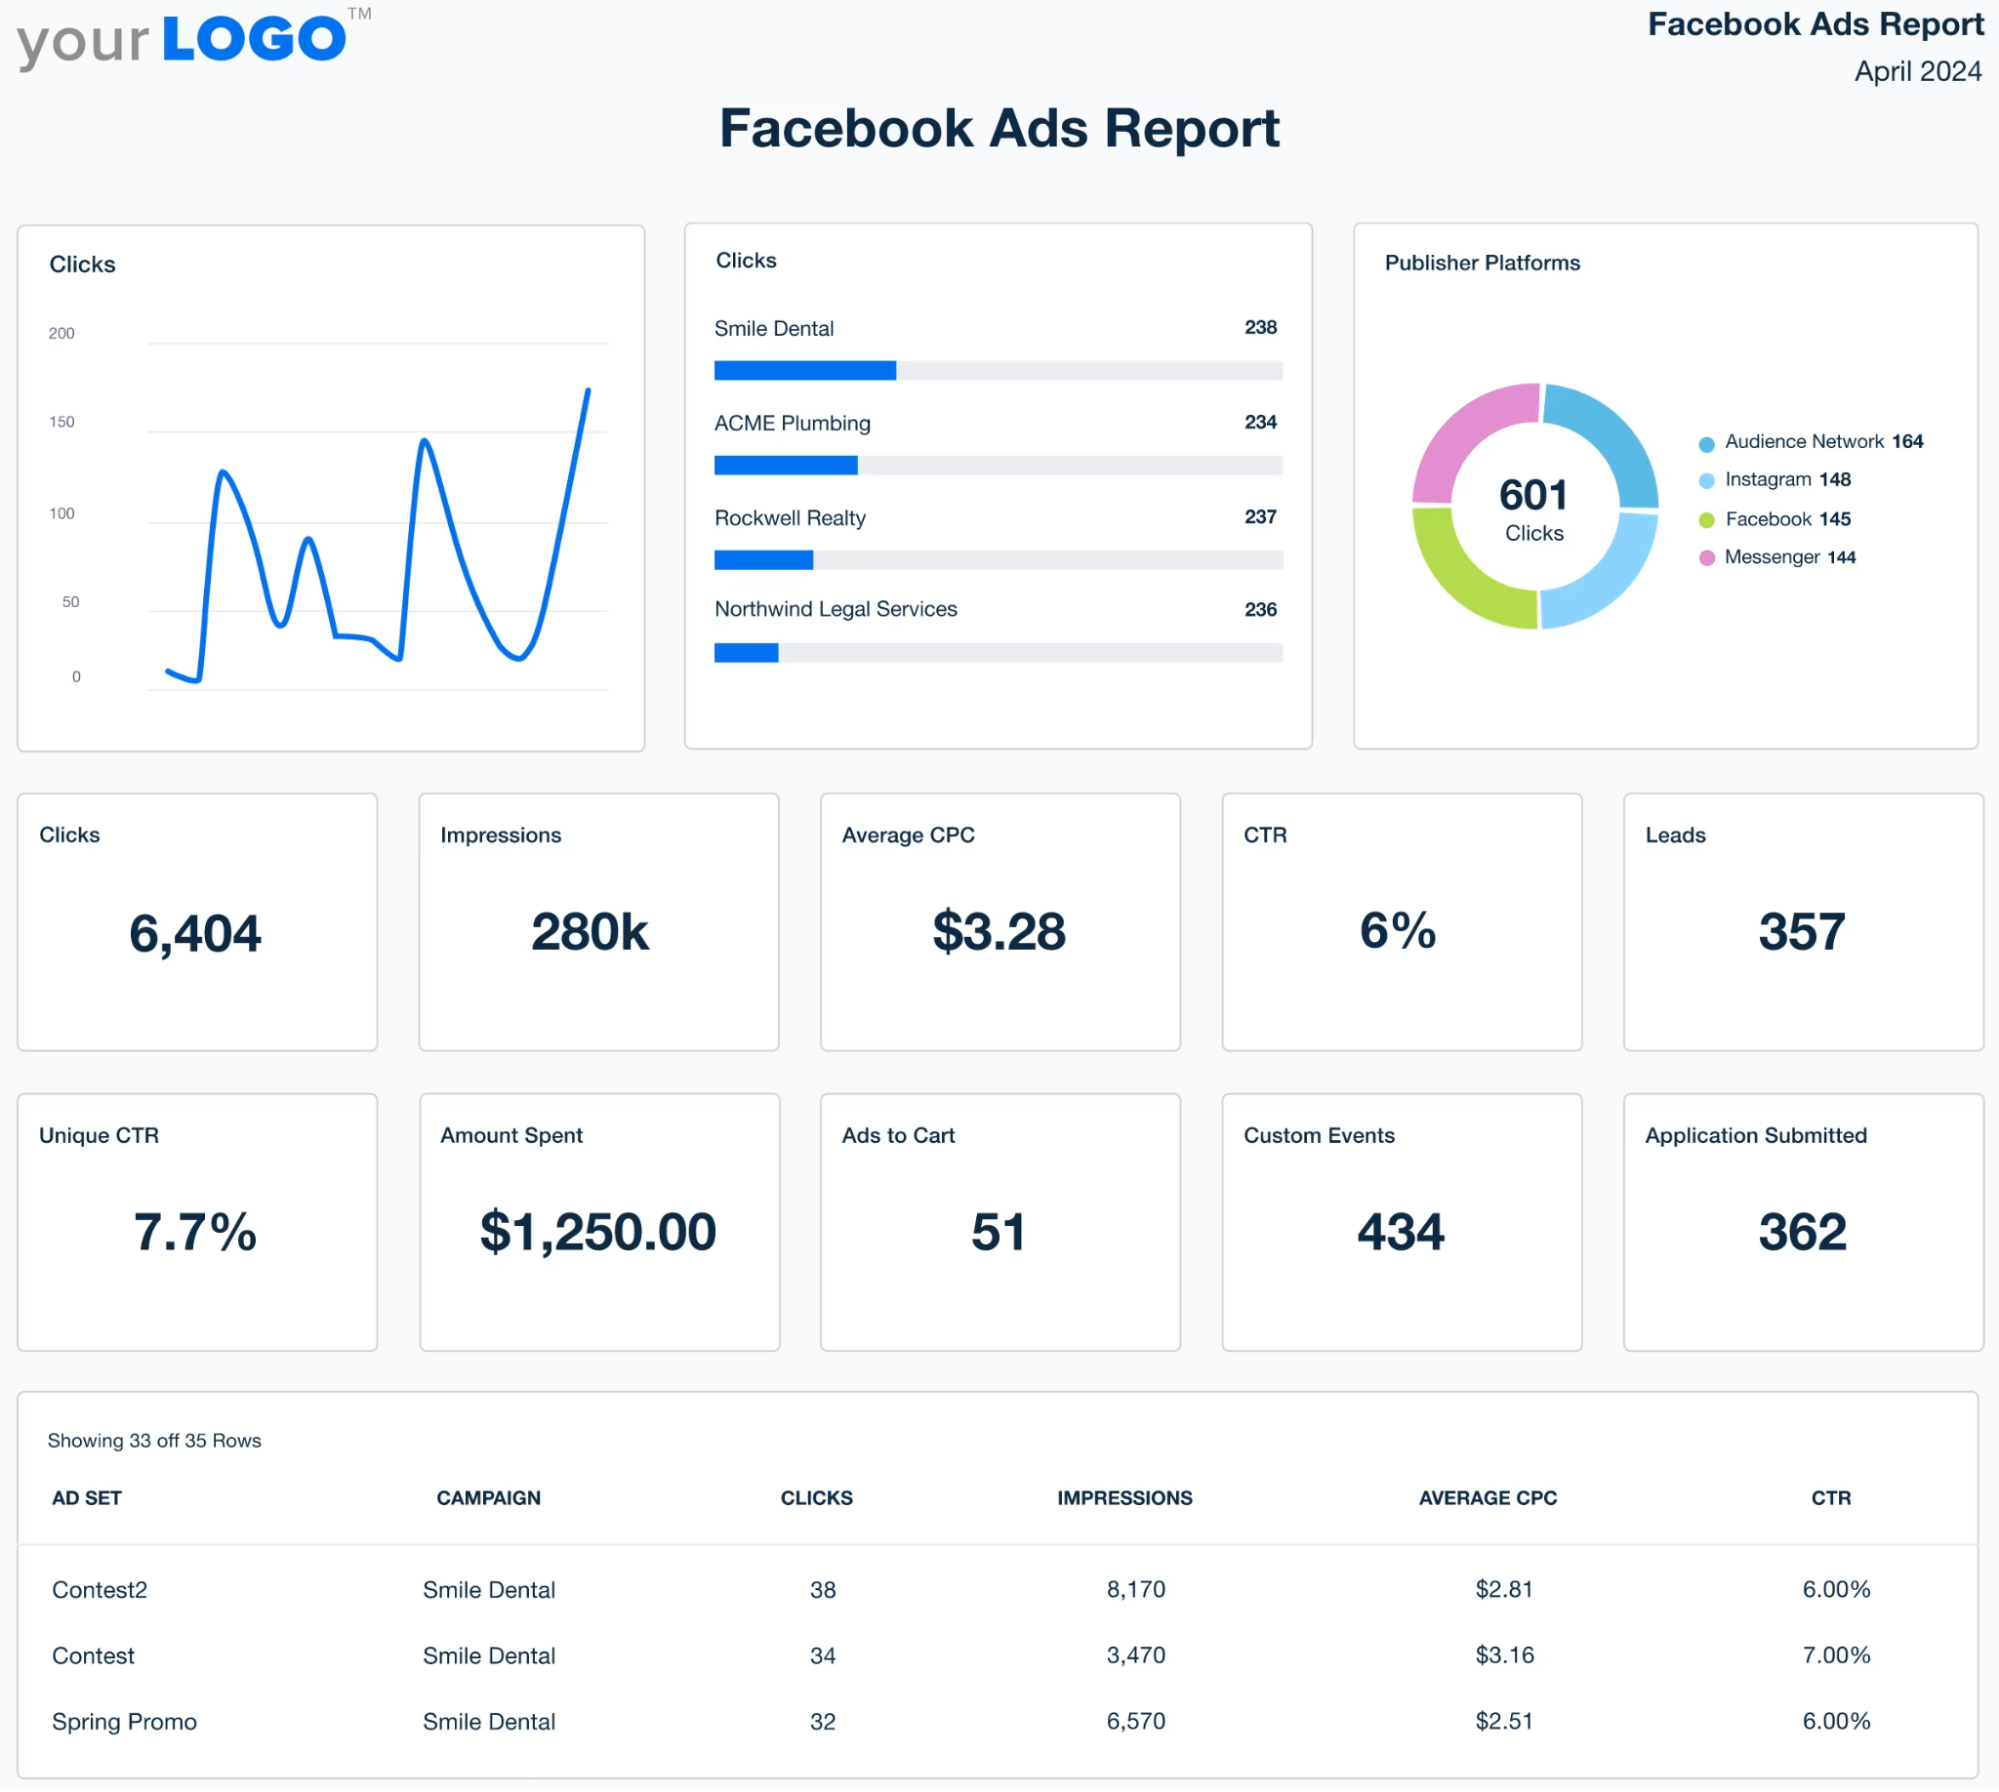
Get it here: Free AgencyAnalytics Facebook Ads template
Template 3: Free Google Data Studio Facebook Ads Report Template
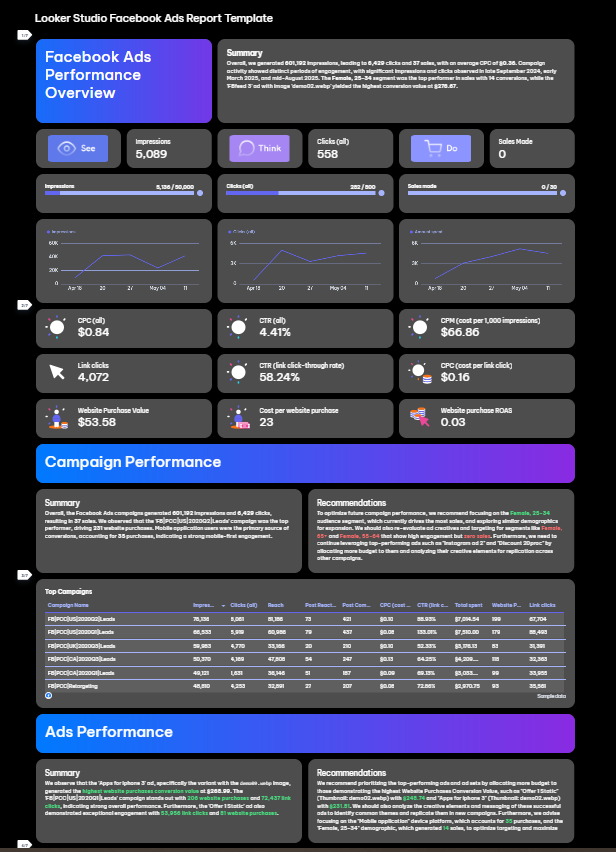
Get it here: Free Google Data Studio Facebook Ads template
Finding the Best Facebook Ads Reporting Tool for Your Needs
Facebook Ads reporting comes down to one question: what decision are you trying to make, and what data do you need to make it confidently?
Agencies, for example, prioritize automation and white-labeling, so spending time manually formatting reports is a marginal problem. E-commerce brands need attribution accuracy; making budget decisions based on Facebook's reported numbers is a revenue problem.
Media buyers managing high volumes need reporting that feeds directly into action.
Start with the free options if you're in the early stages. Upgrade when your manual reporting time exceeds an hour per week, or when the decisions you're making are limited by the quality of the data you're seeing.
And if you're managing campaigns at scale, look seriously at platforms that treat reporting and action as the same thing. After all, understanding your data is just as important as having access to it.
FAQs
What is the best free Facebook Ads reporting tool?
Google Data Studio is the strongest free option available. It's a fully featured dashboard builder from Google that connects to Facebook Ads via a free connector.
How accurate is your data in Facebook Ads reporting tools?
The accuracy of your Facebook Ads data depends on the tool you're using; however, most reporting tools pull directly from Meta's API, so campaign-metric levels are accurate.
How long does it take to set up a Facebook Ads reporting tool?
Typically, it can take around 30 minutes to set up and edit a report, or even longer if you're building it from scratch.
Can I use one reporting tool for both Facebook Ads and Google Ads?
Yes. Most tools on this list support cross-platform reporting out of the box. They pull data from Facebook Ads and Google Ads into the same dashboard, so you can compare performance side by side without switching between platforms.
Why do my Facebook Ads numbers look different in a third-party reporting tool vs. Ads Manager?
Metrics like spend, impressions, and clicks are pulled directly from Meta's API and should match. The discrepancy usually shows up in conversion data, where attribution models, time windows, and iOS 14 signal loss can produce different numbers depending on which tool you're using and how it counts conversions.